Vizualizarea relațiilor liniare

Introducere în modelarea liniară în Python

Jason Vestuto

Data Scientist

Grafice rapide

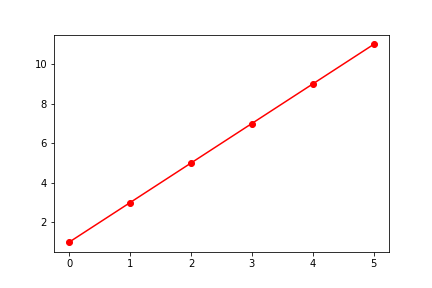
import matplotlib.pyplot as plt
plt.plot(x, y, 'r-o')
plt.show()
Introducere în modelarea liniară în Python

Interfața orientată pe obiecte

# Import the pyplot module
import matplotlib.pyplot as plt
# Create figure and axis objects
fig, axis = plt.subplots()
# Prepare initial style options
options = dict(marker='o', color='blue')
Introducere în modelarea liniară în Python

Interfața orientată pe obiecte

# Call the plot method on the axis object
line = axis.plot(x, y, **options)
# Modify the axis object with set methods
_ = axis.set_ylabel('Times')
_ = axis.set_xlabel('Distances')
# Display figure
plt.show()
Introducere în modelarea liniară în Python

Vizualizarea datelor liniare

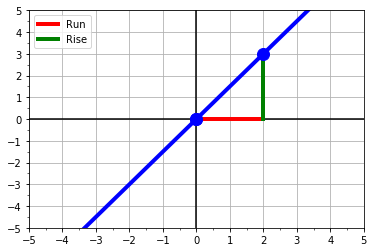
  • două puncte:
    • (x1,y1) = (0,0)
    • (x2,y2) = (2,3)
  • variația x și y:
    • dy = (y2 - y1) = 3 - 0
    • dx = (x2 - x1) = 2 - 0
  • pantă = creștere/deplasare
    • slope = dy/dx = 3/2
  • interceptare:
    • când x=0: y1 = 0

Grafic ilustrând creșterea față de deplasare, demonstrând panta

Introducere în modelarea liniară în Python

Să exersăm!

Introducere în modelarea liniară în Python

Preparing Video For Download...