Introducere în Seaborn
Vizualizarea datelor cu Seaborn – nivel intermediar

Chris Moffitt
Instructor
Peisajul vizualizării în Python
- Peisajul vizualizării în Python este complex și poate fi copleșitor
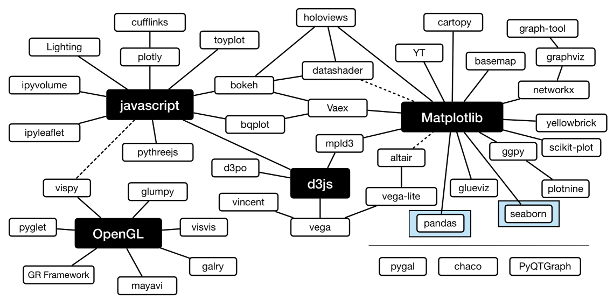
Matplotlib
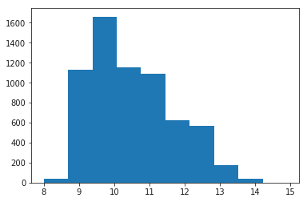
matplotliboferă elementele de bază pentru vizualizările Seaborn- Poate fi utilizat și independent pentru reprezentarea datelor
import matplotlib.pyplot as plt import pandas as pddf = pd.read_csv("wines.csv")fig, ax = plt.subplots() ax.hist(df['alcohol'])
Pandas
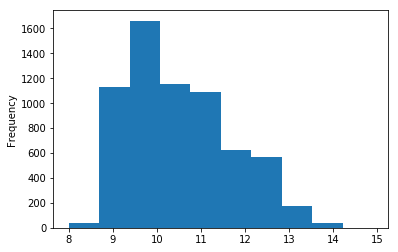
pandaseste o bibliotecă fundamentală pentru analiza datelor- Suportă și funcționalități de bază pentru reprezentări grafice
import pandas as pddf = pd.read_csv("wines.csv") df['alcohol'].plot.hist()
Seaborn histplot
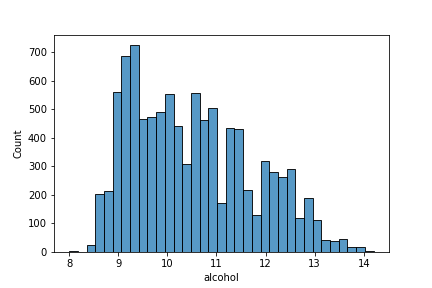
histploteste similar cu histograma prezentată în exemplele anterioare- Implicit, generează o histogramă, dar poate genera și alte grafice complexe
import seaborn as snssns.histplot(df['alcohol'])
Seaborn displot
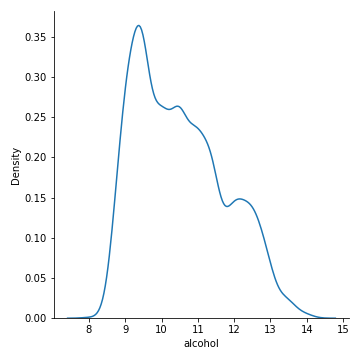
displotutilizeazăhistplotși alte funcții pentru reprezentarea distribuțiilor- Implicit, generează o histogramă, dar poate genera și alte tipuri de grafice
import seaborn as snssns.displot(df['alcohol'], kind='kde')
Histogramă pandas vs. Displot
- Histogramă pandas
df['alcohol'].plot.hist()- Frecvența reală a observațiilor
- Fără contur la bare
- Intervale largi
- Fără etichetă pe axa x
- Seaborn displot
sns.displot(df['alcohol'])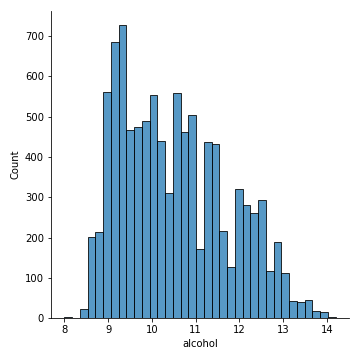
- Etichetă automată pe axa x
- Paletă de culori estompată
- Grafic mai curat

