Tipuri de grafice categoriale
Vizualizarea datelor cu Seaborn – nivel intermediar

Chris Moffitt
Instructor
Tipuri de grafice - per observație
Tipuri de grafice - reprezentări abstracte
Tipuri de grafice - estimări statistice
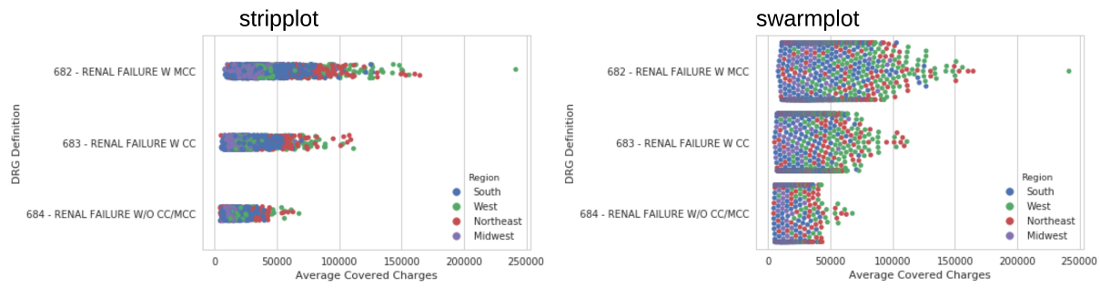
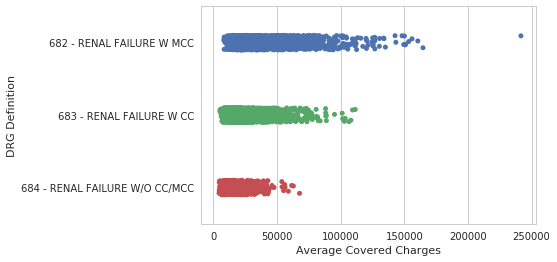
Grafice per observație - stripplot
sns.stripplot(data=df, y="DRG Definition",
              x="Average Covered Charges",
              jitter=True)
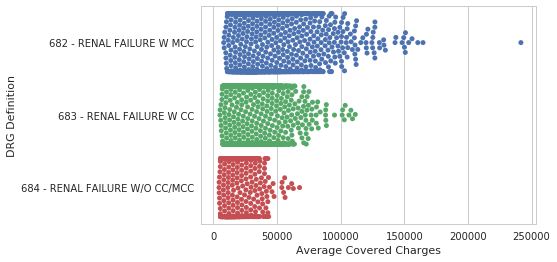
Grafice per observație - swarmplot
sns.swarmplot(data=df, y="DRG Definition",
              x="Average Covered Charges")
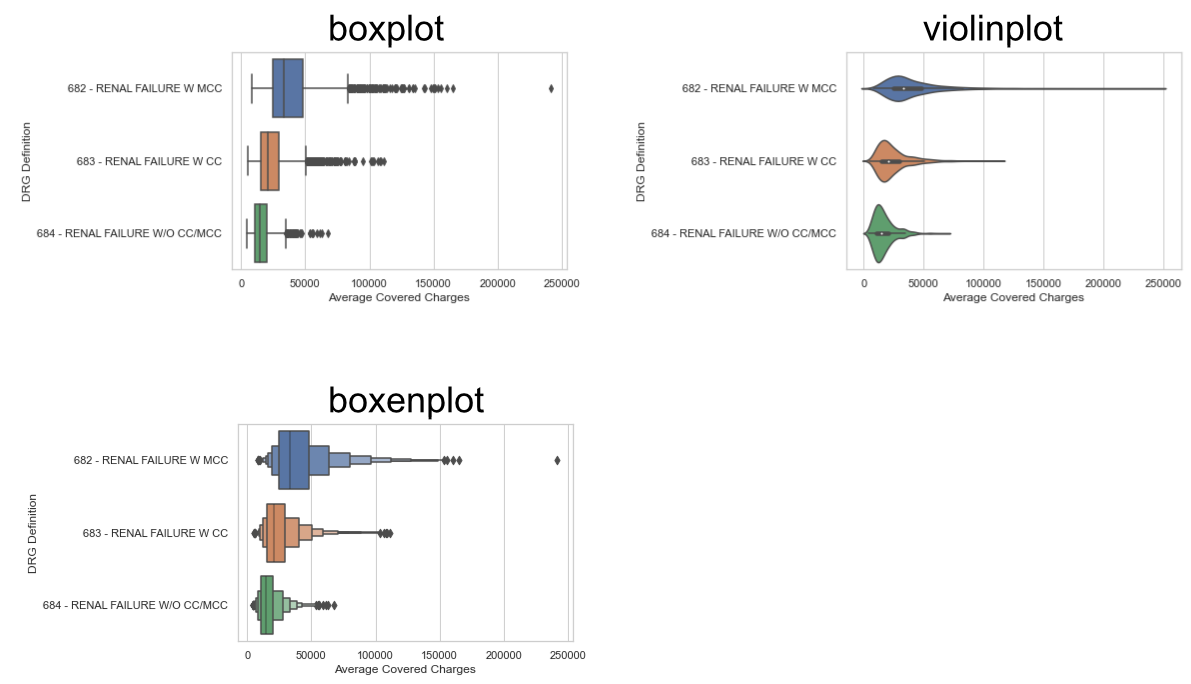
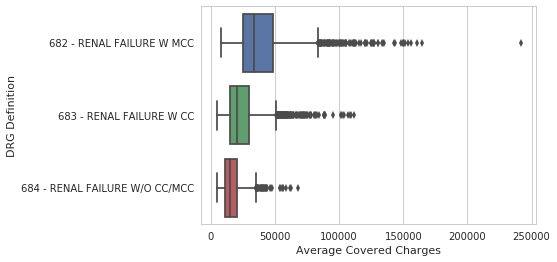
Reprezentări abstracte - boxplot
sns.boxplot(data=df, y="DRG Definition",
            x="Average Covered Charges")
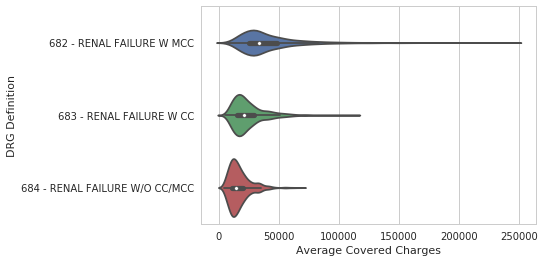
Reprezentare abstractă - violinplot
sns.violinplot(data=df, y="DRG Definition",
               x="Average Covered Charges")
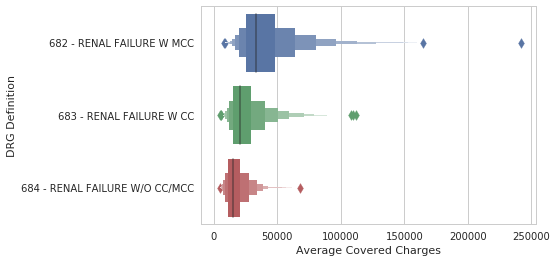
Reprezentare abstractă - boxenplot
sns.boxenplot(data=df, y="DRG Definition",
              x="Average Covered Charges")
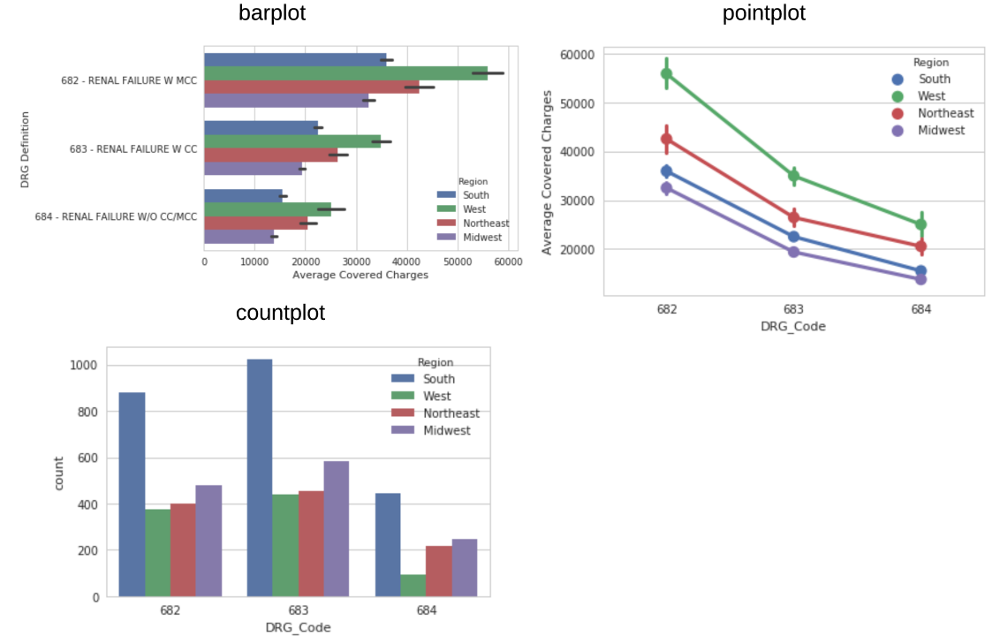
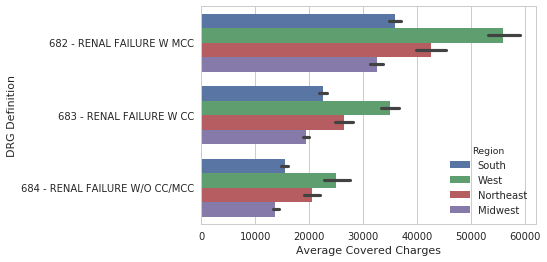
Estimări statistice - barplot
sns.barplot(data=df, y="DRG Definition",
            x="Average Covered Charges",
            hue="Region")
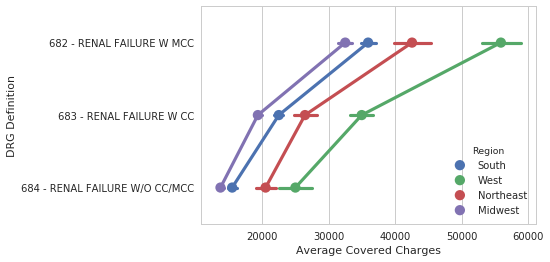
Estimări statistice - pointplot
sns.pointplot(data=df, y="DRG Definition",
              x="Average Covered Charges",
              hue="Region")
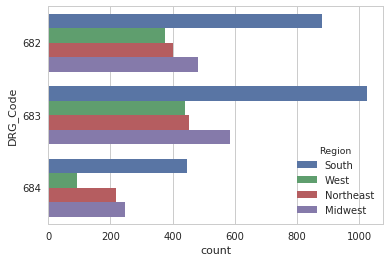
Estimări statistice - countplot
sns.countplot(data=df, y="DRG_Code", hue="Region")