Grafice de regresie în Seaborn
Vizualizarea datelor cu Seaborn – nivel intermediar

Chris Moffitt
Instructor
Introducere în regplot
- Funcția
regplotgenerează un grafic de dispersie cu o linie de regresie - Utilizarea este similară cu
displot - Variabilele
data,xșiytrebuie definite
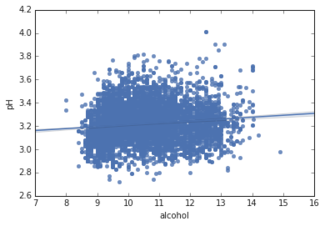
sns.regplot(data=df, x="alcohol", y="pH" )
lmplot() se construiește pe baza regplot()
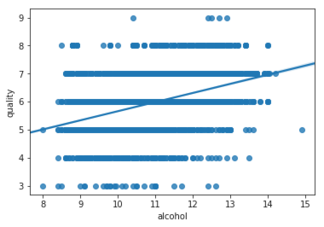
regplot- nivel de bază
sns.regplot(data=df,
            x="alcohol",
            y="quality")
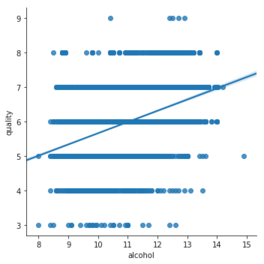
lmplot- nivel înalt
sns.lmplot(data=df,
           x="alcohol",
           y="quality")
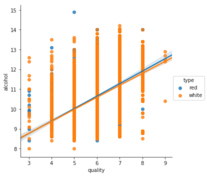
Fatetare cu lmplot
- Organizați datele după culori (
hue)
sns.lmplot(data=df,
           x="quality",
           y="alcohol",
           hue="type")
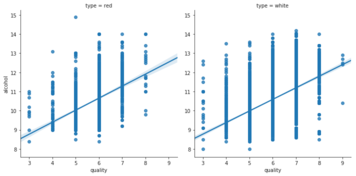
- Organizați datele pe coloane (
col)
sns.lmplot(data=df,
           x="quality",
           y="alcohol",
           col="type")