Trelliscope in the tidyverse
Visualizing Big Data with Trelliscope in R

Ryan Hafen
Author, TrelliscopeJS
Stock market data
library(dplyr)
glimpse(stocks)
Rows: 125,928
Columns: 8
$ symbol   <chr> "TWOU", "TWOU", "TWOU", "TWOU", "TWOU", "TWOU", "TWOU", "T...
$ date     <date> 2016-01-04, 2016-01-05, 2016-01-06, 2016-01-07, 2016-01-0...
$ open     <dbl> 27.21, 26.92, 26.19, 25.84, 25.31, 24.87, 23.82, 23.40, 21...
$ high     <dbl> 27.500, 27.420, 26.530, 26.470, 25.790, 24.870, 24.100, 23...
$ low      <dbl> 26.360, 26.280, 25.950, 24.523, 24.220, 23.220, 22.430, 21...
$ close    <dbl> 27.04, 26.54, 26.38, 25.23, 24.32, 23.72, 23.27, 21.85, 22...
$ volume   <dbl> 530200, 448800, 297200, 635200, 364500, 404900, 1012100, 6...
$ adjusted <dbl> 27.04, 26.54, 26.38, 25.23, 24.32, 23.72, 23.27, 21.85, 22...
Visualizing stock data
library(dplyr)
library(plotly)
candlestick_plot <- function(d)
  plot_ly(d, x = ~date, type = "candlestick",
    open = ~open, close = ~close,
    high = ~high, low = ~low)
candlestick_plot(filter(stocks, symbol == "AAPL"))

Tidyverse: nested data frames
by_symbol <- stocks %>%
  group_by(symbol) %>%
  nest()
by_symbol
# A tibble: 500 x 2
   symbol data
   <chr>  <list>
 1 TWOU   <tibble [252 × 7]>
 2 JOBS   <tibble [252 × 7]>
 3 ABMD   <tibble [252 × 7]>
 4 ACHC   <tibble [252 × 7]>
 5 ACAD   <tibble [252 × 7]>
 6 ACIW   <tibble [252 × 7]>
# ... with 494 more rows
Tidyverse: computing on nested data frames
The purrr map_*() functions
by_symbol <- mutate(by_symbol,
  last_close = map_dbl(data, function(x) tail(x$close, 1)))
by_symbol
# A tibble: 500 x 3
   symbol data               last_close
   <chr>  <list>                  <dbl>
 1 TWOU   <tibble [252 × 7]>       30.2
 2 JOBS   <tibble [252 × 7]>       33.8
 3 ABMD   <tibble [252 × 7]>      113
 4 ACHC   <tibble [252 × 7]>       33.1
 5 ACAD   <tibble [252 × 7]>       28.8
 6 ACIW   <tibble [252 × 7]>       18.2
# ... with 494 more rows
Trelliscope in the tidyverse: plot columns
map_plot()
library(trelliscopejs)
by_symbol <- mutate(by_symbol,
  panel = map_plot(data, candlestick_plot))
# A tibble: 500 x 4
   symbol data               last_close panel
   <chr>  <list>                  <dbl> <list>
 1 TWOU   <tibble [252 × 7]>       30.2 <S3: plotly>
 2 JOBS   <tibble [252 × 7]>       33.8 <S3: plotly>
 3 ABMD   <tibble [252 × 7]>      113   <S3: plotly>
 4 ACHC   <tibble [252 × 7]>       33.1 <S3: plotly>
 5 ACAD   <tibble [252 × 7]>       28.8 <S3: plotly>
 6 ACIW   <tibble [252 × 7]>       18.2 <S3: plotly>
# ... with 494 more rows
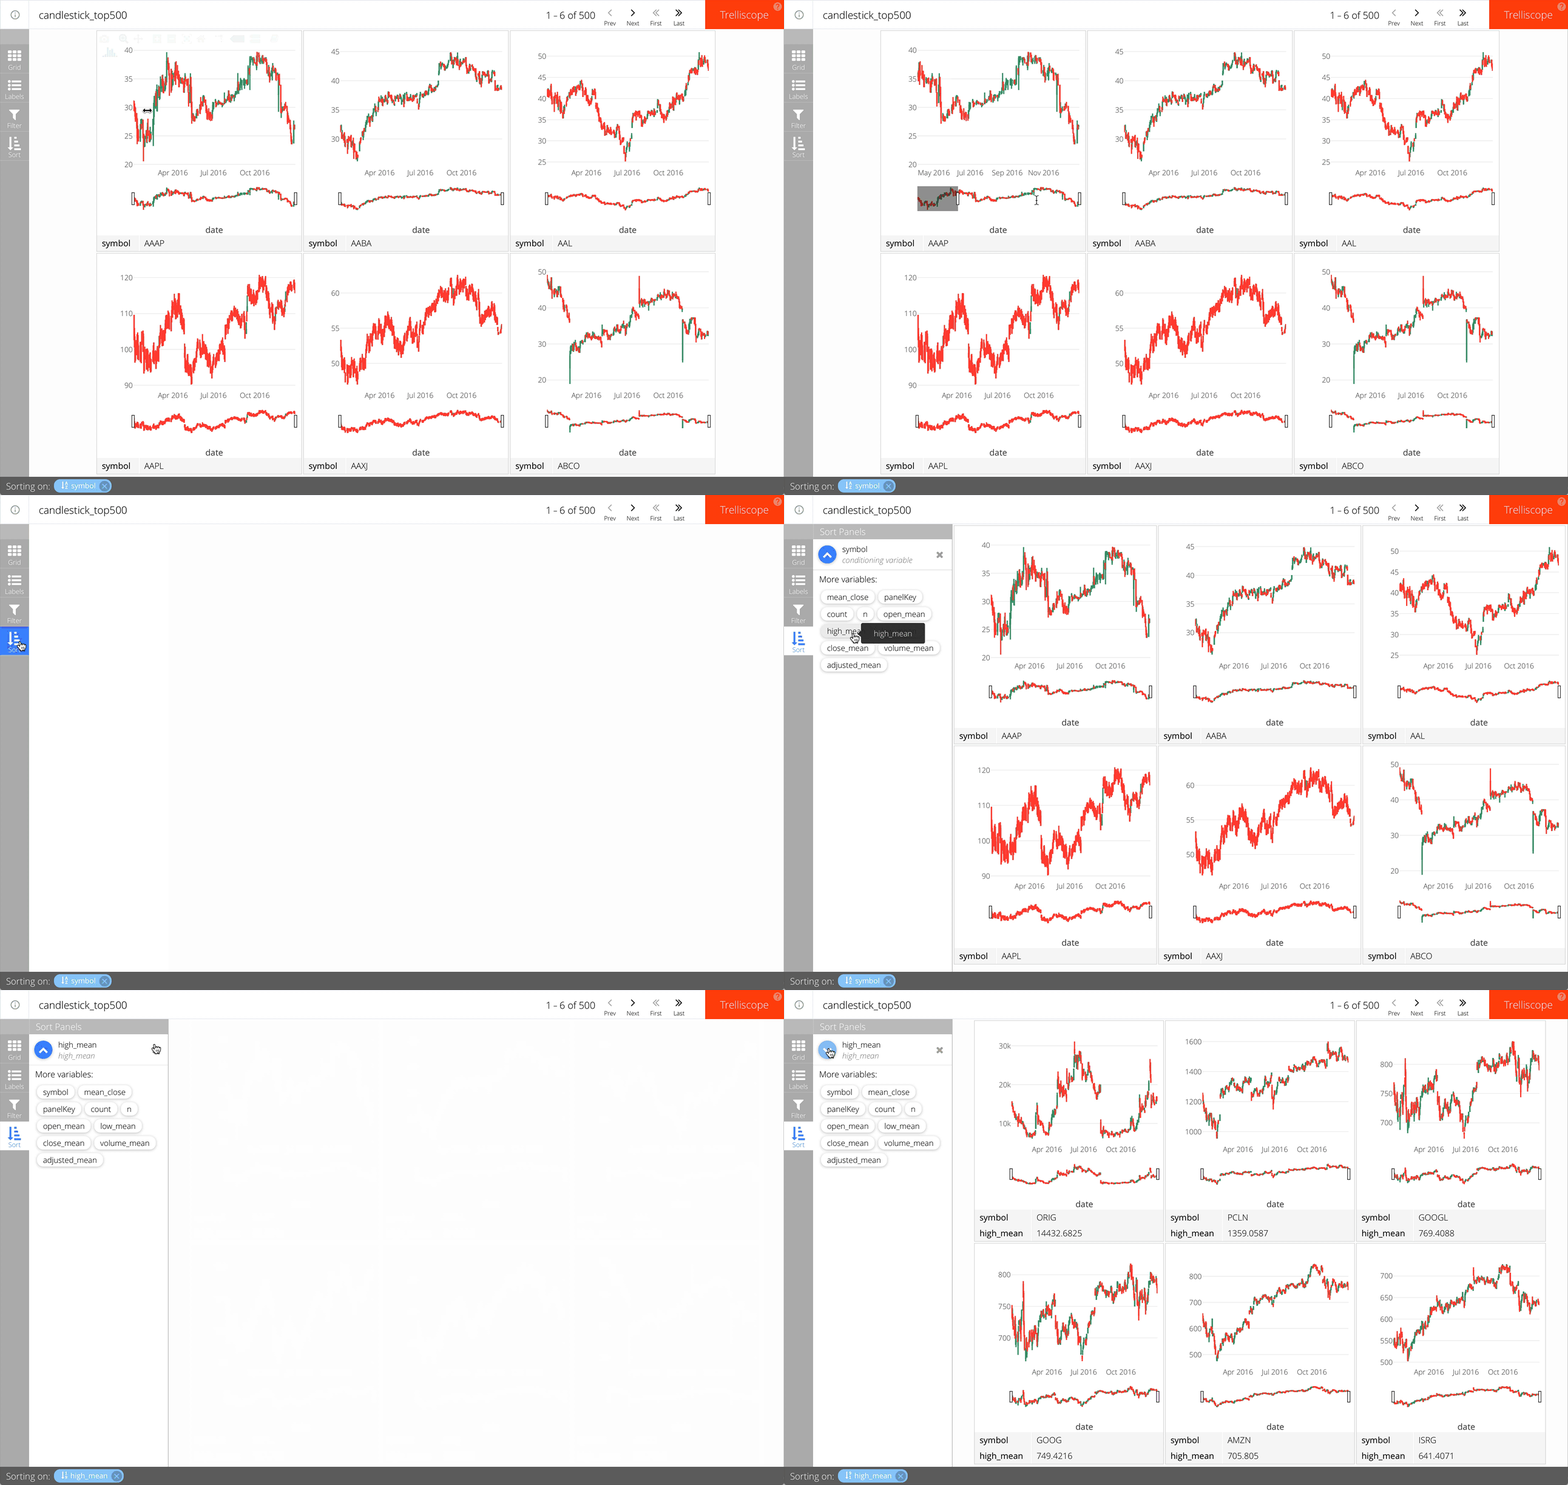
Creating the display
trelliscope(by_symbol,
  name = "candlestick_top500",
  nrow = 2, ncol = 3)

Let's practice!
Visualizing Big Data with Trelliscope in R

