Adding your own cognostics
Visualizing Big Data with Trelliscope in R

Ryan Hafen
Author, TrelliscopeJS
New variables as cognostics
All variables in the data passed in to ggplot() are inspected for use as cognostics.
- If the variable is numeric and varies within each panel group, a set of summary statistics is computed for each panel.
- If the variable is constant within each panel group, a single cognostic with that value is computed for each panel.
Latest life expectancy as a cognostic
gap <- gapminder %>% group_by(country) %>% mutate(latestLifeExp = tail(lifeExp, 1))gap
# A tibble: 1,704 x 7
# Groups:   country [142]
   country     continent  year lifeExp      pop gdpPercap latestLifeExp
   <fct>       <fct>     <int>   <dbl>    <int>     <dbl>         <dbl>
 1 Afghanistan Asia       1952    28.8  8425333       779          43.8
 2 Afghanistan Asia       1957    30.3  9240934       821          43.8
 3 Afghanistan Asia       1962    32.0 10267083       853          43.8
 4 Afghanistan Asia       1967    34.0 11537966       836          43.8
 5 Afghanistan Asia       1972    36.1 13079460       740          43.8
 6 Afghanistan Asia       1977    38.4 14880372       786          43.8
# ... with 1,698 more rows
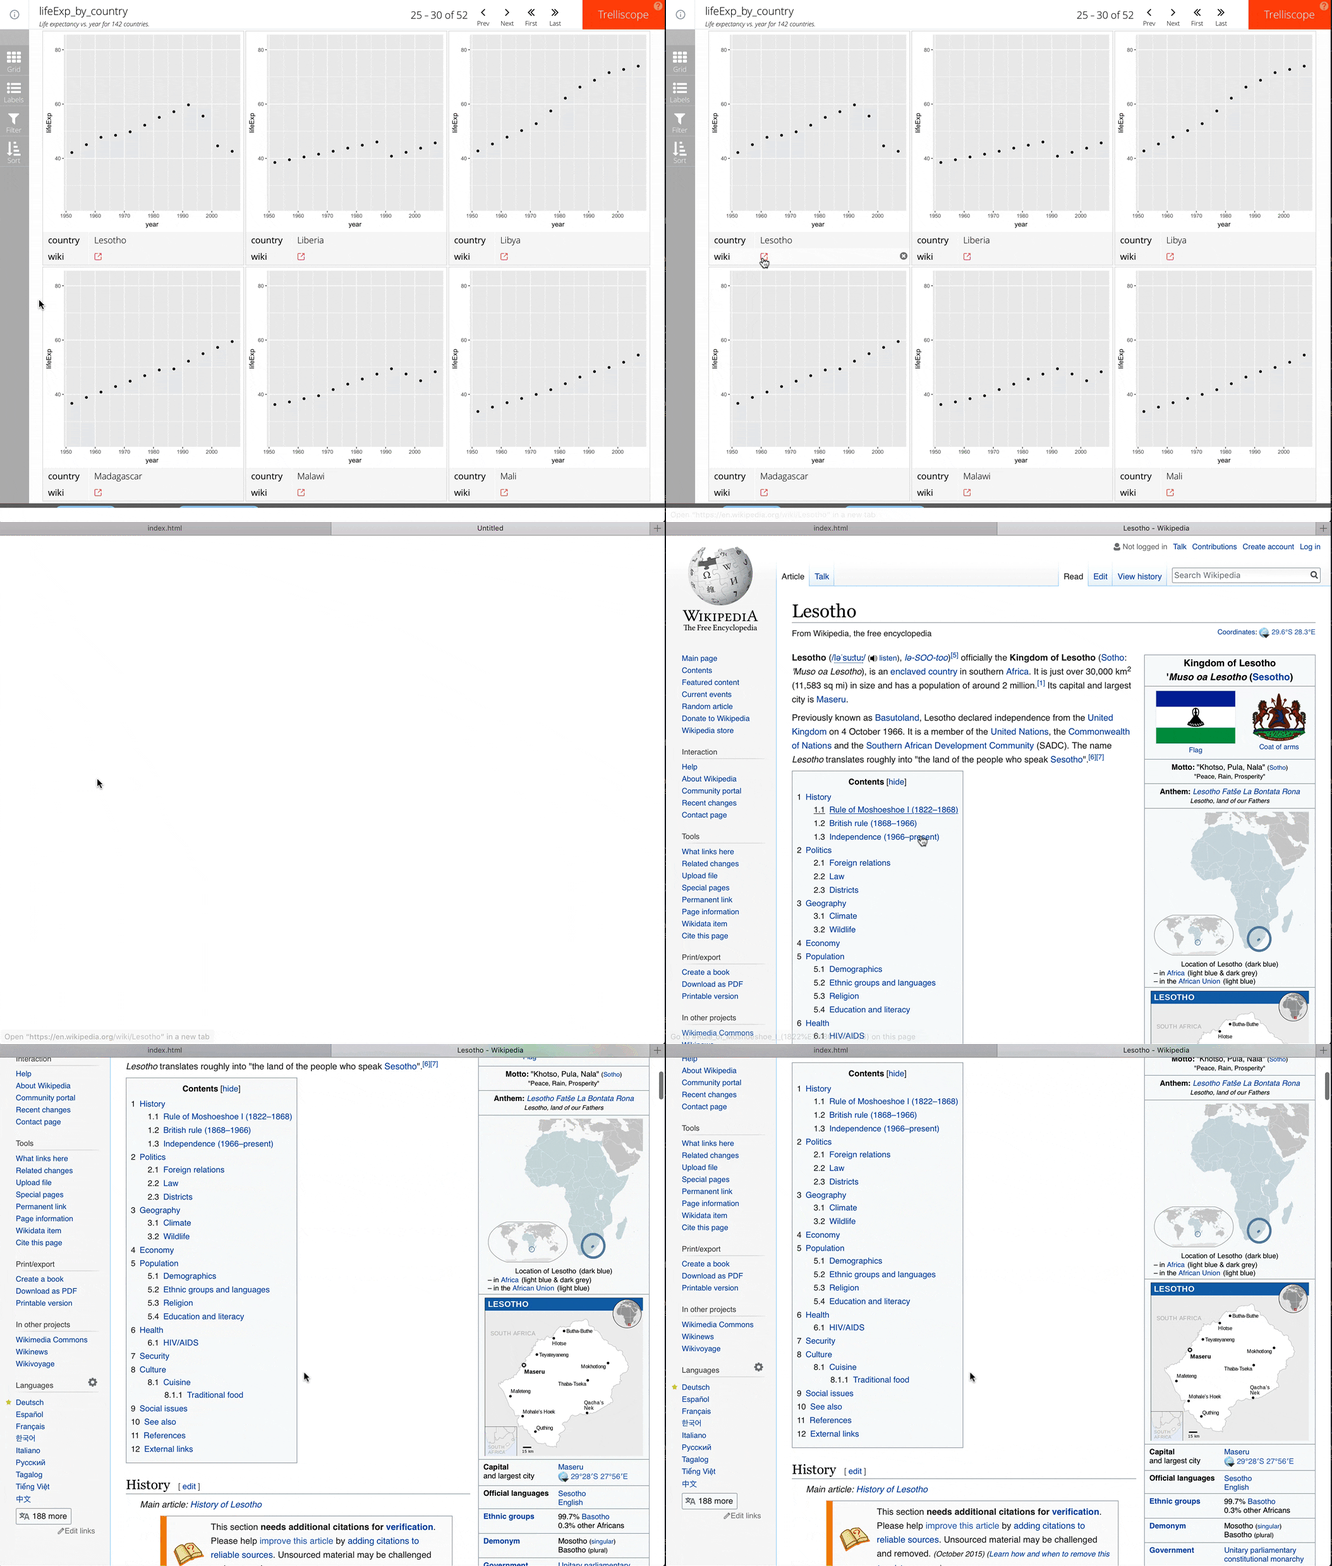
Hyperlinks as cognostics
gap <- gapminder %>%
  group_by(country, continent) %>%
  mutate(wiki = paste0("https://en.wikipedia.org/wiki/", country))

Customizing custom cognostics
A function cog() can be wrapped around a variable to fine-tune how a cognostic is handled in Trelliscope.
With cog(), some of the most useful things you can specify include:
desc: a meaningful description for the cognosticdefault_label: a boolean specifying whether the cognostic should be shown as a label by default or not
gap$wiki <- cog_href(gap$wiki,
                     desc = "Link to wikipedia",
                     default_label = TRUE)
Let's practice!
Visualizing Big Data with Trelliscope in R

