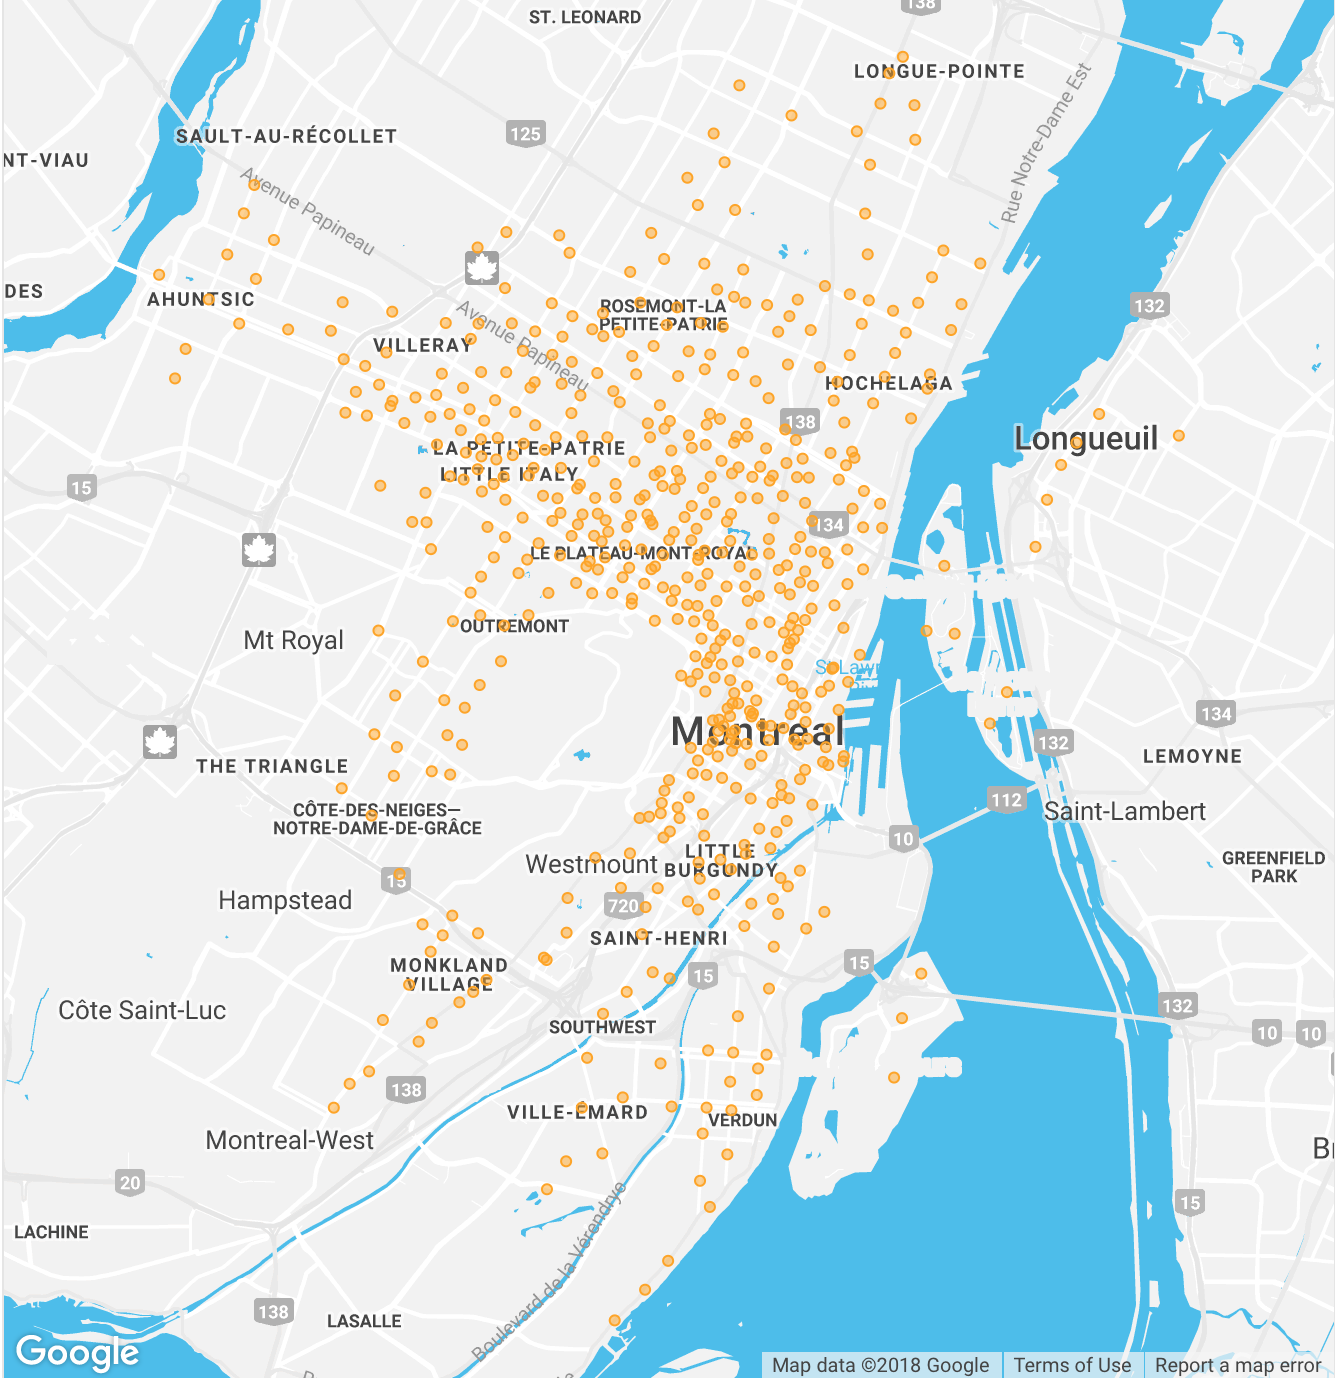
Top 100 routes dataset
Visualizing Big Data with Trelliscope in R

Ryan Hafen
Author, TrelliscopeJS
Studying routes

Route frequency
route_tab <- bike %>%
  filter(start_station_code != end_station_code) %>%
  group_by(start_station_code, end_station_code) %>%
  summarise(n = n()) %>%
  arrange(-n)
# A tibble: 193,632 x 3
# Groups:   start_station_code [546]
   start_station_code end_station_code     n
                <int>            <int> <int>
 1               6050             6406  2428
 2               6406             6052  2364
 3               6136             6163  2352
 4               6052             6026  2001
 5               6052             6406  1983
# ... with 193,627 more rows
top_routes <- paste(
  route_tab$start_station_code[1:100],
  route_tab$end_station_code[1:100])
top100 <- bike %>%
  filter(paste(start_station_code, end_station_code) %in% top_routes)
# A tibble: 133,786 x 12
   start_date          start_station_code end_date            end_station_code
   <dttm>                           <int> <dttm>                         <int>
 1 2017-04-15 00:10:00               6386 2017-04-15 00:13:00             6393
 2 2017-04-15 00:20:00               6221 2017-04-15 00:24:00             6184
 3 2017-04-15 00:42:00               6206 2017-04-15 00:45:00             6411
 4 2017-04-15 00:48:00               6350 2017-04-15 00:50:00            10002
 5 2017-04-15 02:09:00               6070 2017-04-15 02:12:00             6205
 6 2017-04-15 02:07:00               6221 2017-04-15 02:11:00             6184
# ... with 133,780 more rows, and 8 more variables: duration_sec <int>,
#   start_day <date>, start_dow <fct>, weekday <fct>, start_hod <dbl>,
#   start_mon <dbl>, start_wk <dbl>, membership <fct>
route_hod <- top100 %>%
  group_by(start_station_code, end_station_code, start_hod, weekday) %>%
  summarise(n = n())
# join station metadata
route_hod <- route_hod %>%
  left_join(start_stations) %>%
  left_join(end_stations)
# A tibble: 4,114 x 11
# Groups:   start_station_code, end_station_code, start_hod [?]
   start_station_co… end_station_code start_hod weekday     n start_station_na…
               <int>            <int>     <dbl> <fct>   <int> <chr>
 1              6012             6015      0    workwe…    12 Métro St-Laurent…
 2              6012             6015      0    weekend    13 Métro St-Laurent…
 3              6012             6015      1.00 workwe…    11 Métro St-Laurent…
 4              6012             6015      1.00 weekend     2 Métro St-Laurent…
 5              6012             6015      2.00 workwe…     2 Métro St-Laurent…
 6              6012             6015      2.00 weekend     6 Métro St-Laurent…
# ... with 4,108 more rows, and 5 more variables: start_lat <dbl>,
#   start_lon <dbl>, end_station_name <chr>, end_lat <dbl>, end_lon <dbl>
Let's visualize!
Visualizing Big Data with Trelliscope in R

