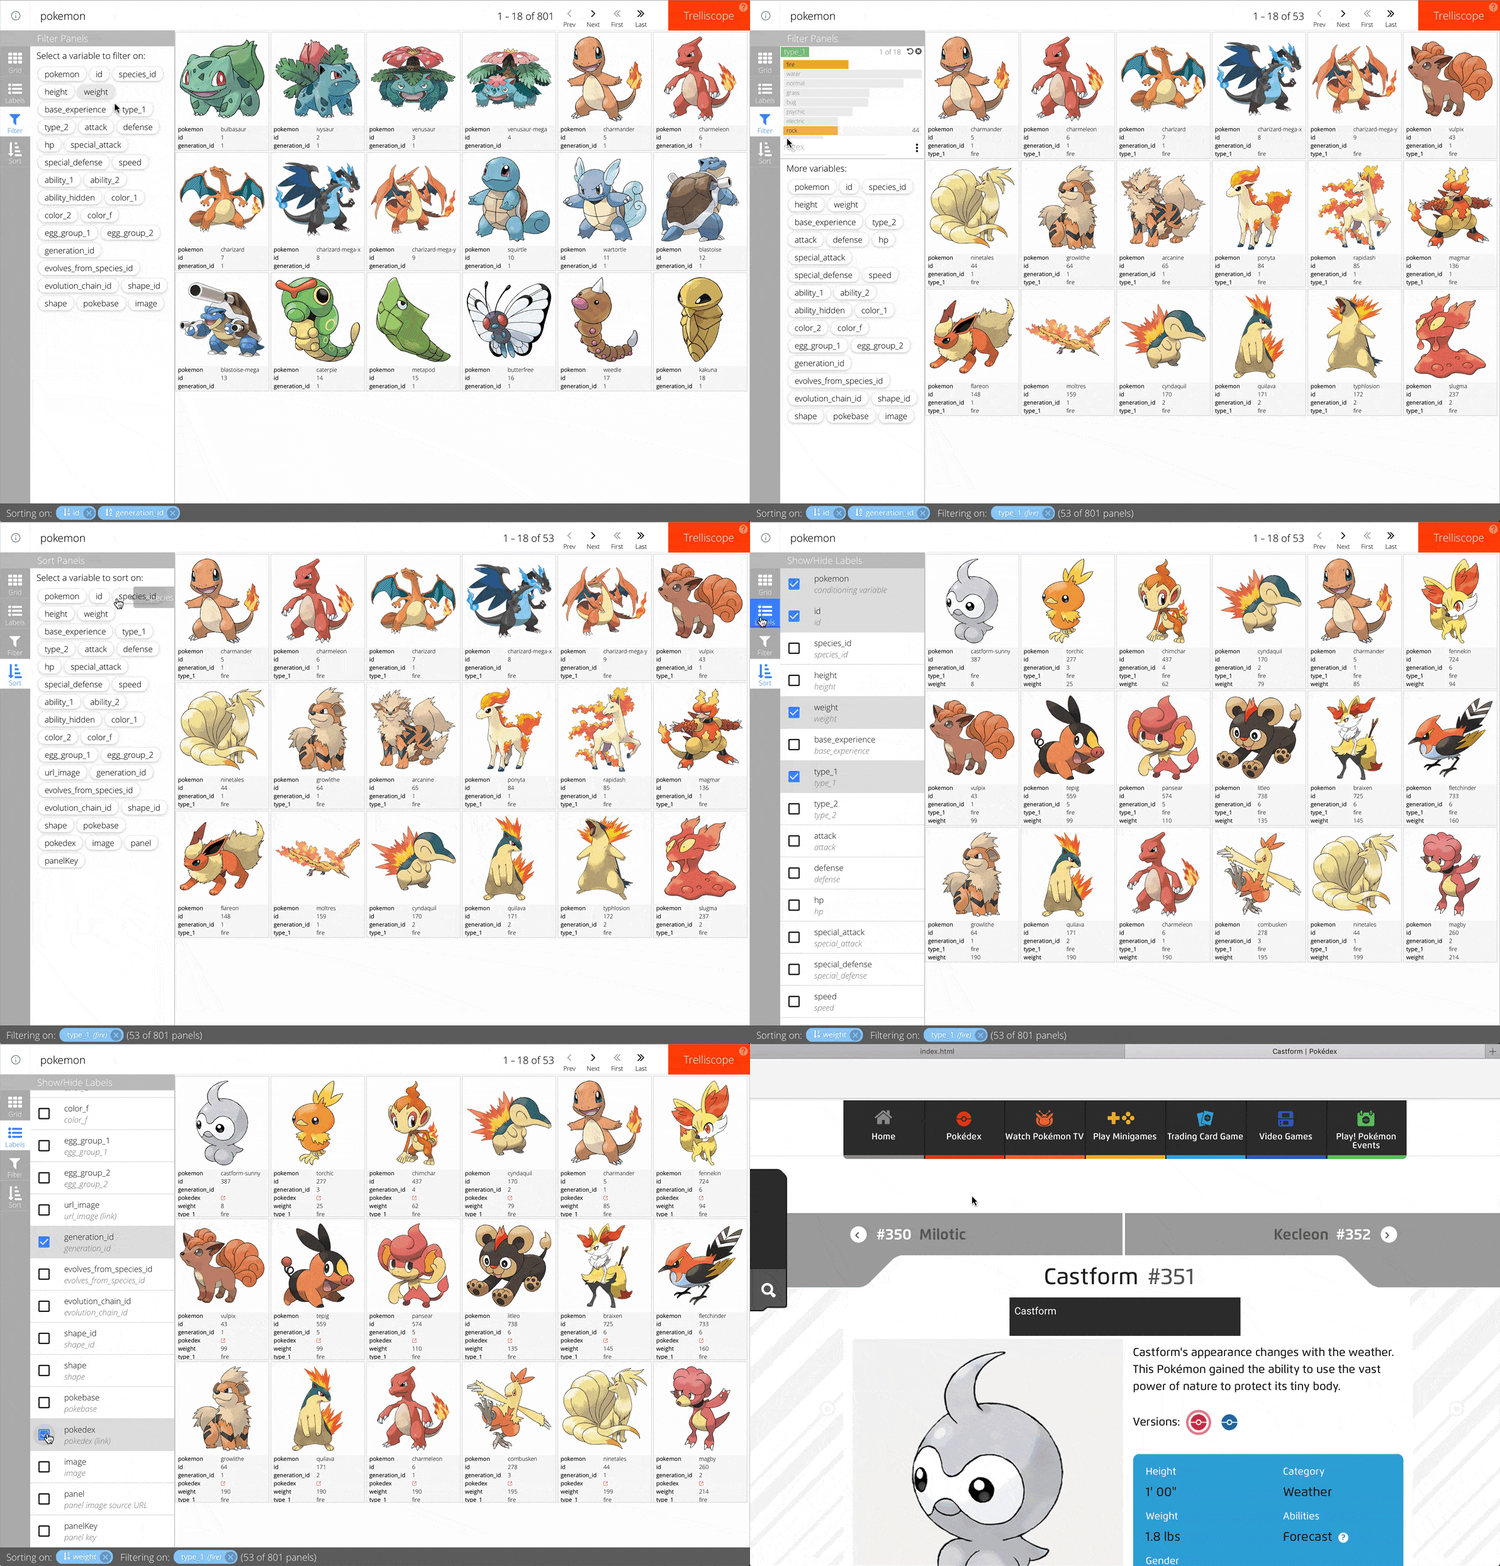
Visualizing databases of images
Visualizing Big Data with Trelliscope in R

Ryan Hafen
Author, TrelliscopeJS
pokemon
# A tibble: 801 x 30
   pokemon     id species_id height weight base_experience type_1 type_2 attack
   <chr>    <int> <chr>       <int>  <int>           <int> <chr>  <chr>   <int>
 1 bulbasa…     1 1               7     69              64 grass  poison     49
 2 ivysaur      2 2              10    130             142 grass  poison     62
 3 venusaur     3 3              20   1000             236 grass  poison     82
 4 venusau…     4 3              24   1555             281 grass  poison    100
 5 charman…     5 4               6     85              62 fire   NA         52
# ... with 796 more rows, and 21 more variables: defense <int>, hp <int>,
#   special_attack <int>, special_defense <int>, speed <int>, ability_1 <chr>,
#   ability_2 <chr>, ability_hidden <chr>, color_1 <chr>, color_2 <chr>,
#   color_f <chr>, egg_group_1 <chr>, egg_group_2 <chr>, url_image <chr>,
#   generation_id <chr>, evolves_from_species_id <chr>,
#   evolution_chain_id <chr>, shape_id <chr>, shape <chr>, pokebase <chr>,
#   pokedex <chr>
Image panels
select(pokemon, url_image)
# A tibble: 801 x 1
   url_image
   <chr>
 1 http://assets.pokemon.com/assets/cms2/img/pokedex/full/001.png
 2 http://assets.pokemon.com/assets/cms2/img/pokedex/full/002.png
 3 http://assets.pokemon.com/assets/cms2/img/pokedex/full/003.png
 4 http://assets.pokemon.com/assets/cms2/img/pokedex/full/003_f2.png
 5 http://assets.pokemon.com/assets/cms2/img/pokedex/full/004.png
 6 http://assets.pokemon.com/assets/cms2/img/pokedex/full/005.png
 7 http://assets.pokemon.com/assets/cms2/img/pokedex/full/006.png
 8 http://assets.pokemon.com/assets/cms2/img/pokedex/full/006_f2.png
 9 http://assets.pokemon.com/assets/cms2/img/pokedex/full/006_f3.png
10 http://assets.pokemon.com/assets/cms2/img/pokedex/full/007.png
# ... with 791 more rows
img_panel()
pokemon <- mutate(pokemon,
  panel = img_panel(url_image))
trelliscope(pokemon, name = "pokemon", nrow = 3, ncol = 6)
A database of images

Local images
path <- file.path(tempdir(), "pokemon_local")
dir.create(path)
for (url in pokemon$url_image)
  download.file(url, destfile = file.path(path, basename(url)))
pokemon$image <- basename(pokemon$url_image)
pokemon <- mutate(pokemon,
  panel = img_panel_local(image))

trelliscope(pokemon, name = "pokemon", nrow = 3, ncol = 6,
  path = path)
Let's practice!
Visualizing Big Data with Trelliscope in R

