Introduction

Visualizing Big Data with Trelliscope in R

Ryan Hafen

Author, TrelliscopeJS

Overview

Visualizing Big Data with Trelliscope in R

Summaries of one variable

  • Continuous variables
  • Categorical variables
  • Temporal variables
Visualizing Big Data with Trelliscope in R

Gapminder data

library(gapminder) 
gapminder
# A tibble: 1,704 x 6
   country     continent  year lifeExp      pop gdpPercap
   <fct>       <fct>     <int>   <dbl>    <int>     <dbl>
 1 Afghanistan Asia       1952    28.8  8425333      779.
 2 Afghanistan Asia       1957    30.3  9240934      821.
 3 Afghanistan Asia       1962    32.0 10267083      853.
 4 Afghanistan Asia       1967    34.0 11537966      836.
 5 Afghanistan Asia       1972    36.1 13079460      740.
 6 Afghanistan Asia       1977    38.4 14880372      786.
 7 Afghanistan Asia       1982    39.9 12881816      978.
 8 Afghanistan Asia       1987    40.8 13867957      852.
# ... with 1,696 more rows
Visualizing Big Data with Trelliscope in R

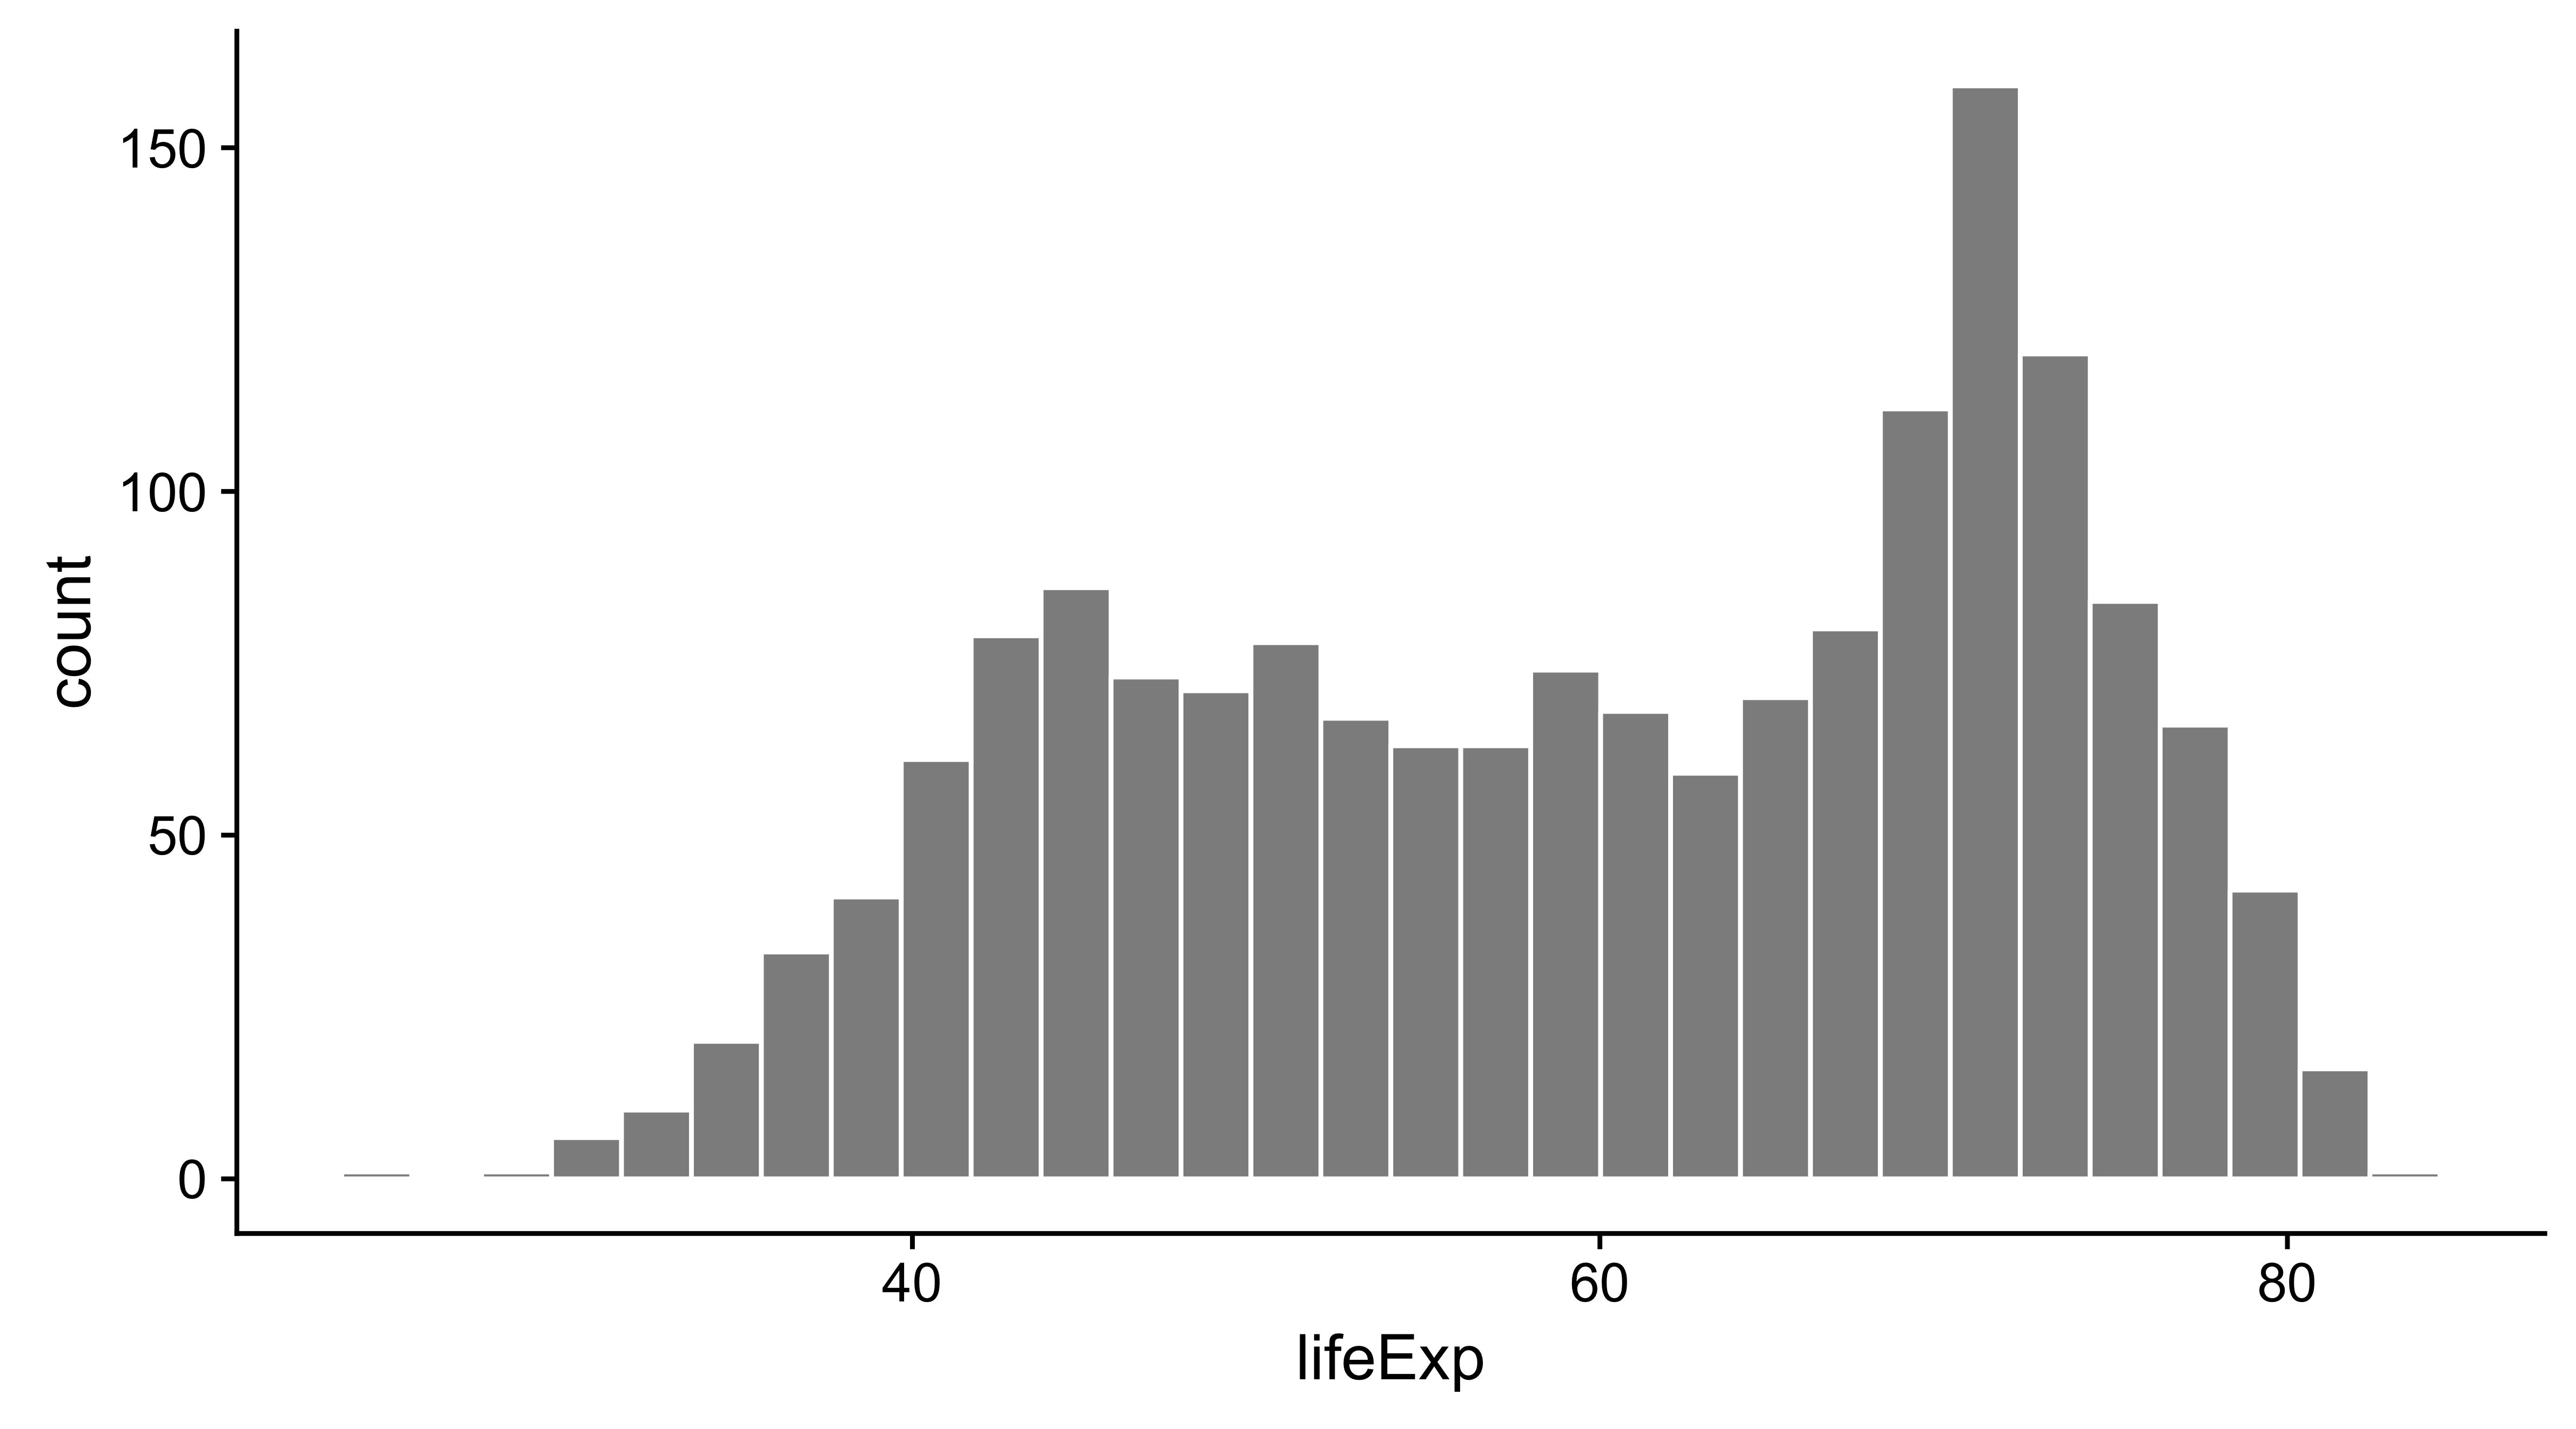
Summaries of one variable: continuous

ggplot(gapminder, aes(lifeExp)) +
  geom_histogram()

Visualizing Big Data with Trelliscope in R

Summaries of one variable: discrete

ggplot(gapminder, aes(continent)) +
  geom_bar()

Visualizing Big Data with Trelliscope in R

Summaries of one variable: temporal

by_year <- gapminder %>%
  group_by(year) %>%
  summarise(medianGdpPercap = median(gdpPercap, na.rm = TRUE))

ggplot(by_year, aes(year, medianGdpPercap)) + geom_line()

Visualizing Big Data with Trelliscope in R

1 Million NYC taxi rides

Random sample of rides from July to December 2016

Visualizing Big Data with Trelliscope in R

Taxi data

tx
# A tibble: 1,000,000 x 7
     pick_day pick_dow total_amount tip_amount payment_type trip_duration
       <date>     <fct>        <dbl>      <dbl>       <fct>         <dbl>
 1 2016-07-09      Sat        47.60      23.80         Card     26.116667
 2 2016-07-28      Thu         9.96       1.66         Card      5.866667
 3 2016-07-20      Wed         6.80       1.00         Card      4.916667
 4 2016-07-30      Sat        11.75       1.95         Card     10.350000
 5 2016-07-19      Tue         7.30       0.00         Cash      6.866667
 6 2016-07-07      Thu        12.05       2.75         Card      7.050000
 7 2016-07-29      Fri        13.80       0.00         Cash     13.700000
 8 2016-07-17      Sun        14.16       2.36         Card     13.233333
 9 2016-07-18      Mon        13.30       0.00         Cash     13.666667
10 2016-07-14      Thu        21.80       2.00         Card     29.316667
# ... with 999,990 more rows, and 1 more variables: pick_wkday <lgl>
Visualizing Big Data with Trelliscope in R

Let's practice!

Visualizing Big Data with Trelliscope in R

Preparing Video For Download...