R pentru utilizatorii de SAS
Melinda Higgins, PhD
Research Professor/Senior Biostatistician Emory University

ggplot2 este un pachet grafic puternic pentru Rggplot provine de la „grammar of graphics" (gramatica graficelor)ggplot2 construiește graficele prin straturi succesive# Create plot for x=sex and y=diameter
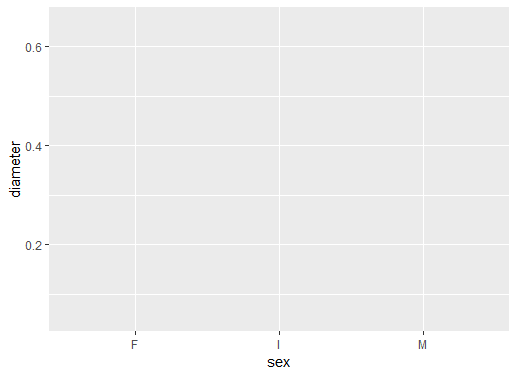
ggplot(data = abalone, aes(sex, diameter))
ggplot()data = abaloneSetează aes la sex și diameter
Încă nu există obiecte grafice în plot
sexdiameter
# Add boxplot geometric object or geom
ggplot(data = abalone,
aes(sex, diameter)) +
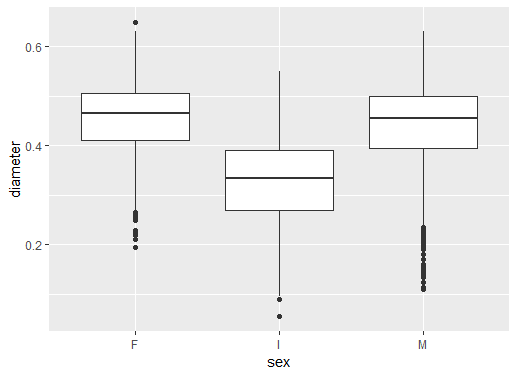
geom_boxplot()
+ adaugă un stratBoxplot geom_boxplot() adăugat
Rezultatul e o serie de boxploturi
F femele, I juvenili și M masculi
# Add black white theme
ggplot(data = abalone,
aes(sex, diameter)) +
geom_boxplot() +
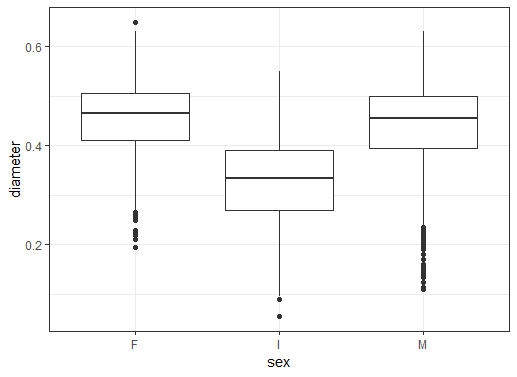
theme_bw()
theme_bw()
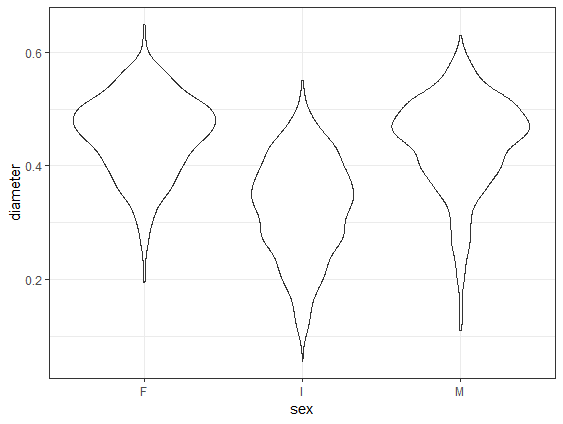
# Change to geom_violin()
ggplot(data = abalone,
aes(sex, diameter)) +
geom_violin() +
theme_bw()
geom_violin înlocuiește geom_boxplot
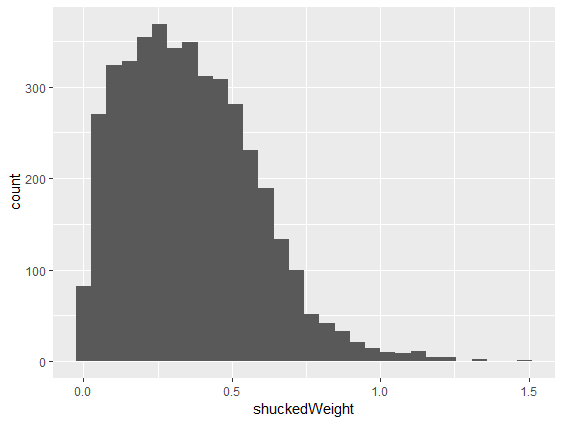
# Make histogram of shuckedWeight
ggplot(abalone, aes(shuckedWeight)) +
geom_histogram()
geom_histogram()aes() la shuckedWeight
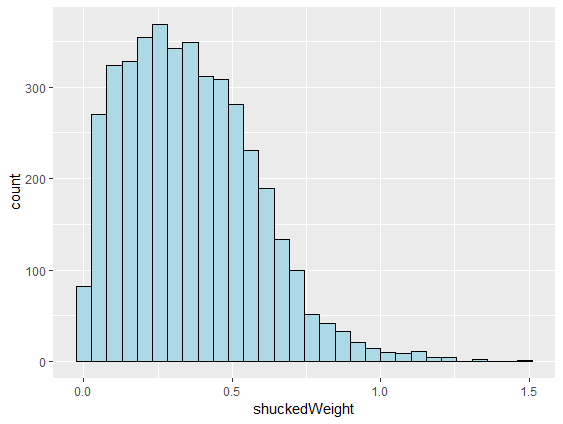
# Make lines black and fill light blue
ggplot(abalone, aes(shuckedWeight)) +
geom_histogram(color = "black",
fill = "lightblue")
color pentru liniile barelorfill a barelor()
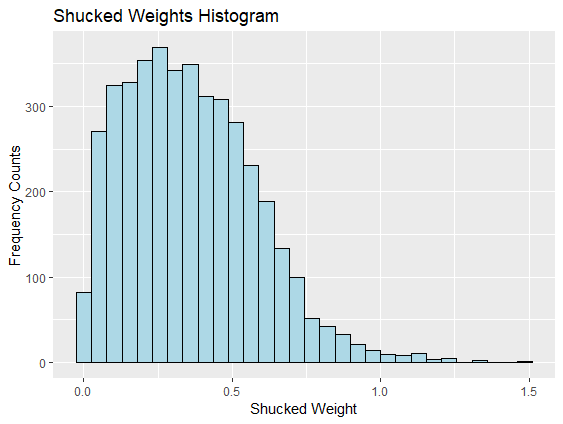
# Add x, y axis labels and title
ggplot(abalone, aes(shuckedWeight)) +
geom_histogram(color = "black",
fill = "lightblue") +
xlab("Shucked Weight") +
ylab("Frequency Counts") +
ggtitle("Shucked Weights Histogram")
xlab() și ylab() pentru axeggtitle() pentru titlu
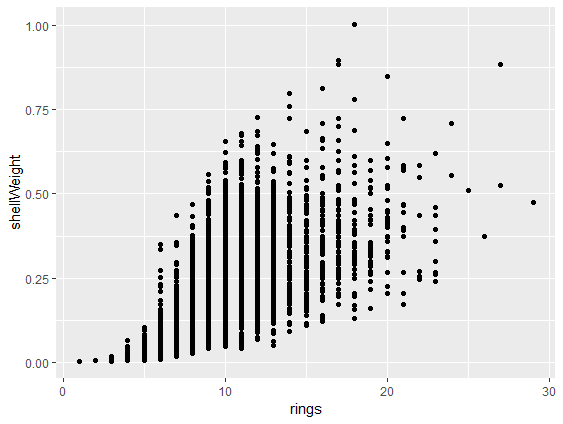
# Make scatterplot with geom_point()
ggplot(abalone,
aes(rings, shellWeight)) +
geom_point()
aes are nevoie de două variabilegeom_point() adaugă punctele
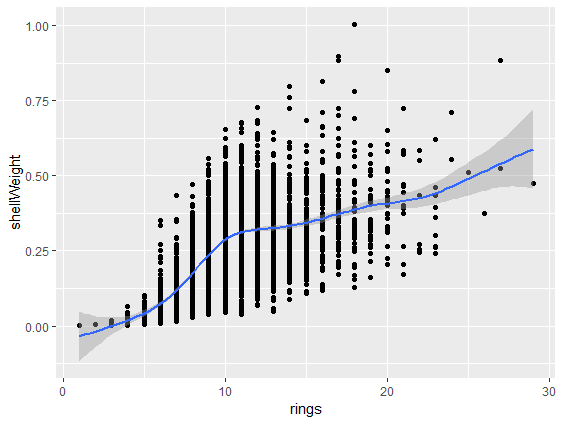
# Add smoothed fit line
ggplot(abalone,
aes(rings, shellWeight)) +
geom_point() +
geom_smooth()
geom_smooth() la scatterplot
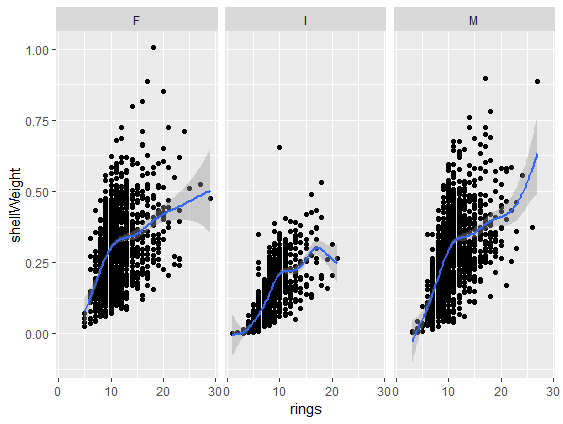
# Add panels using facet_wrap()
ggplot(abalone,
aes(rings, shellWeight)) +
geom_point() +
geom_smooth() +
facet_wrap(vars(sex))
facet_wrap()vars(sex) definește variabila pentru panouri
ggplot2R pentru utilizatorii de SAS