Personalizarea aspectului
Vizualizare interactivă a datelor cu plotly în R

Adam Loy
Statistician, Carleton College
Etichete axe
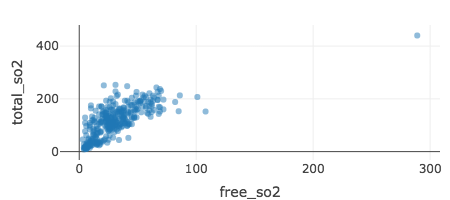
winequality %>%
  plot_ly(x = ~free_so2, y = ~total_so2) %>%
  add_markers(marker = list(opacity = 0.2))
Etichete axe
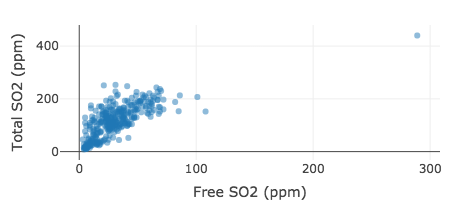
winequality %>%
  plot_ly(x = ~free_so2, y = ~total_so2) %>%
  add_markers(marker = list(opacity = 0.2)) %>%
  layout(xaxis = list(title = "Free SO2 (ppm)"),
         yaxis = list(title = "Total SO2 (ppm)"))
Titluri
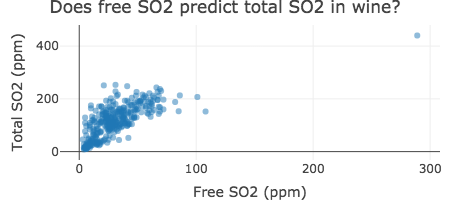
winequality %>%
  plot_ly(x = ~free_so2, y = ~total_so2) %>%
  add_markers(marker = list(opacity = 0.2)) %>%
  layout(xaxis = list(title = "Free SO2 (ppm)"),
         yaxis = list(title = "Total SO2 (ppm)"),
         title = "Does free SO2 predict total SO2 in wine?")
Transformarea axelor
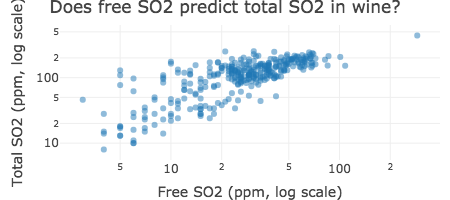
winequality %>%
  plot_ly(x = ~free_so2, y = ~total_so2) %>%
  add_markers(marker = list(opacity = 0.2)) %>%
  layout(xaxis = list(title = "Free SO2 (ppm, log scale)", type = "log"),
         yaxis = list(title = "Total SO2 (ppm, log scale)", type = "log"),
         title = "Does free SO2 predict total SO2 in wine?")
Personalizarea grilei
Personalizarea grilei
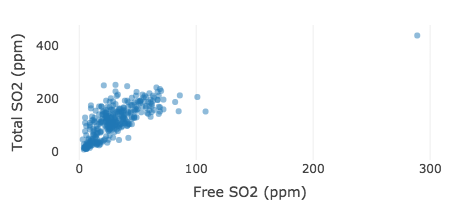
winequality %>%
  plot_ly(x = ~free_so2, y = ~total_so2) %>%
  add_markers(marker = list(opacity = 0.5)) %>%
  layout(xaxis = list(title = "Free SO2 (ppm)", zeroline = FALSE),
         yaxis = list(title = "Total SO2 (ppm)", zeroline = FALSE,
                      showgrid = FALSE))
Personalizarea fundalului
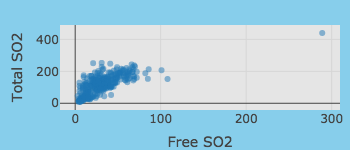
winequality %>%
  plot_ly(x = ~free_so2, y = ~total_so2) %>%
  add_markers(marker = list(opacity = 0.5)) %>%
  layout(xaxis = list(title = "Free SO2 (ppm)"),
         yaxis = list(title = "Total SO2 (ppm)"),
plot_bgcolor = toRGB("gray90"),paper_bgcolor = toRGB("skyblue"))

