Eșantionare ponderată

Analiza datelor din sondaje în Python

EbunOluwa Andrew

Data Scientist

Ce este eșantionarea ponderată?

  • Probabilități inegale
  • Permite cercetătorilor să corecteze probleme din colectarea datelor

Balanță a justiției pe masă, cântar, echilibru

Analiza datelor din sondaje în Python

Variabile comune în eșantionarea ponderată

  • Caracteristici demografice: gen, vârstă, locație, educație
  • Compensează diferențele între participanți și non-participanți la studii
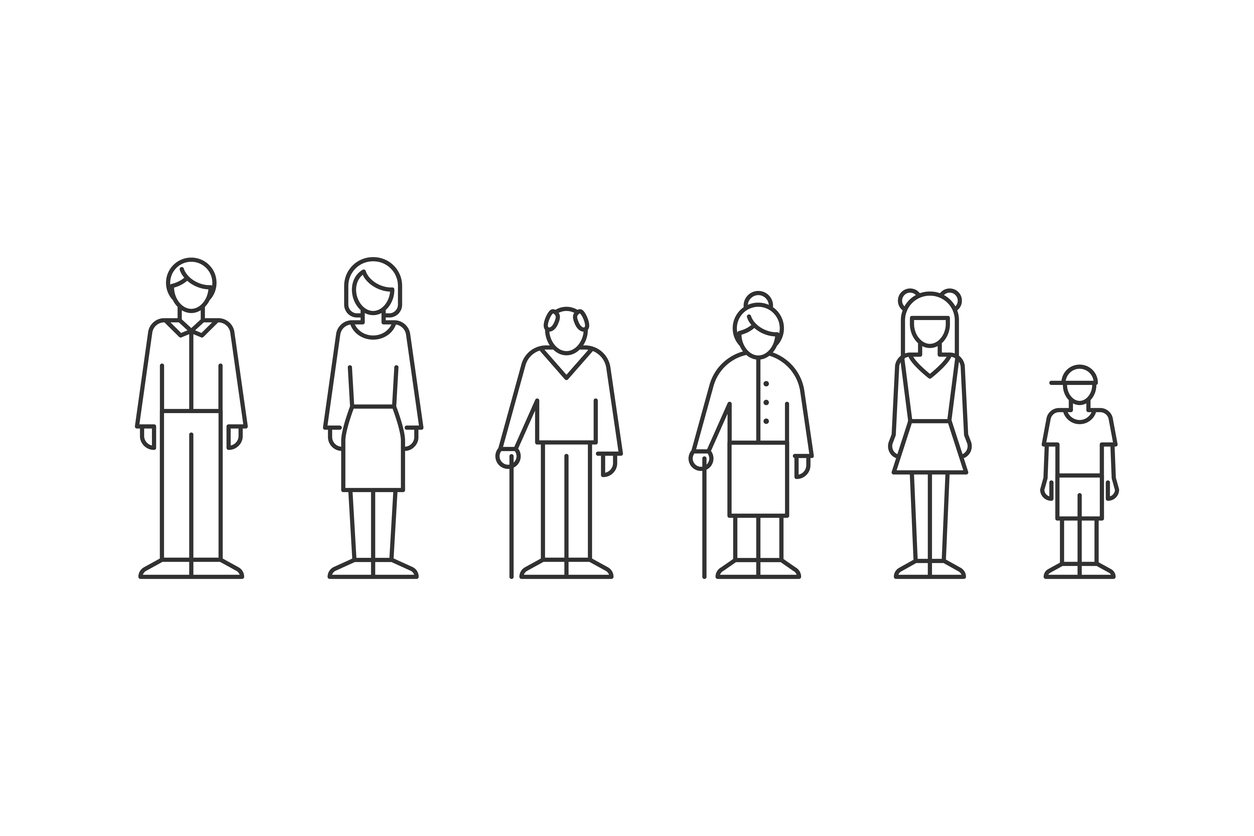
Familii, persoane de vârste diferite, stil contur

Analiza datelor din sondaje în Python

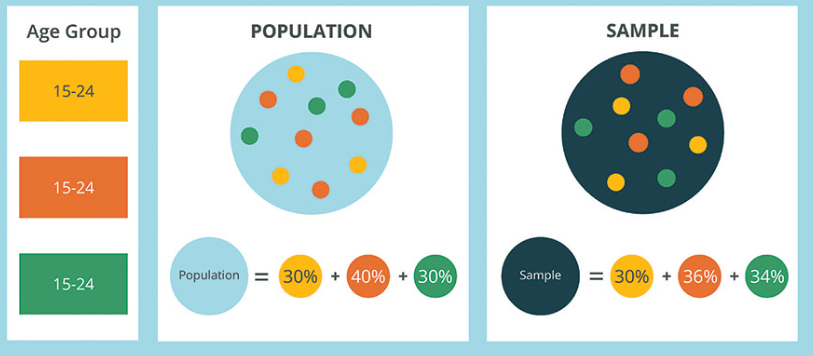
Ponderare bazată pe celule

1 https://www.geopoll.com/blog/weighting-survey-data-raking-cell-weighting/
Analiza datelor din sondaje în Python

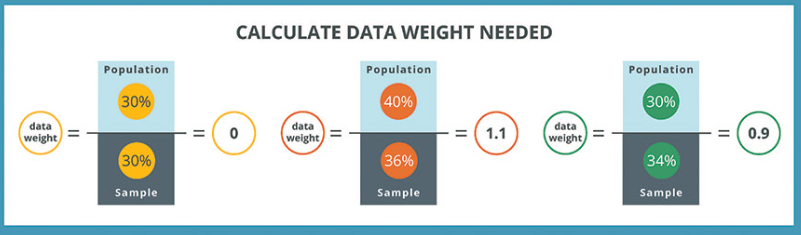
Ponderare bazată pe celule

1 https://www.geopoll.com/blog/weighting-survey-data-raking-cell-weighting/
Analiza datelor din sondaje în Python

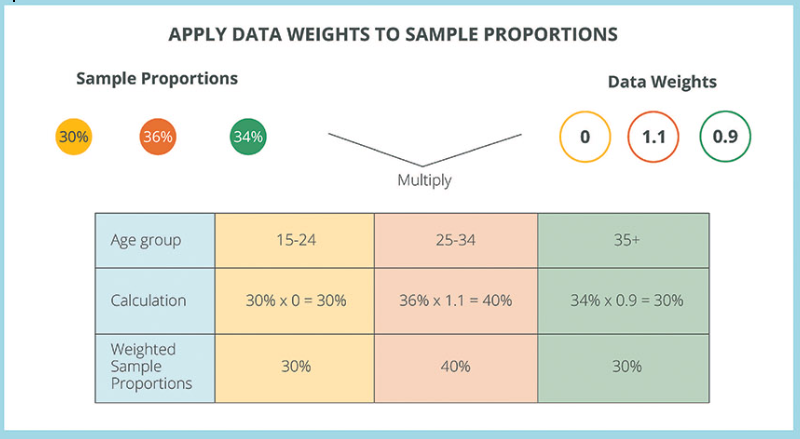
Ponderare bazată pe celule

1 https://www.geopoll.com/blog/weighting-survey-data-raking-cell-weighting/
Analiza datelor din sondaje în Python

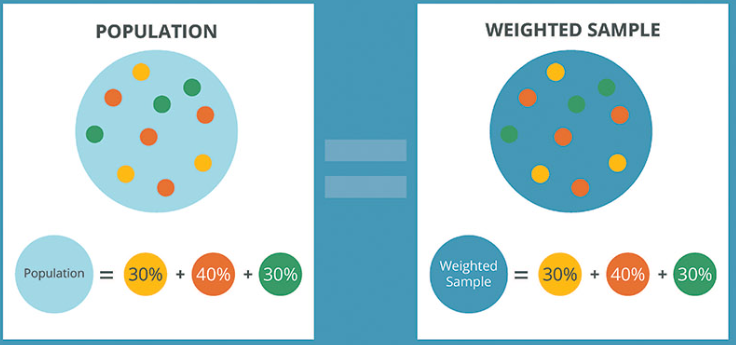
Ponderare bazată pe celule

1 https://www.geopoll.com/blog/weighting-survey-data-raking-cell-weighting/
Analiza datelor din sondaje în Python

Analiza tiparelor de cheltuieli ale tinerilor cu Python
yp_survey
| Gender | Age | Entertainment |
|--------|-----|---------------|
| female |  19 | Agree         |
| female |  20 | Agree         |
| male   |  19 | Agree         |
| female |  19 | Disagree      |
| female |  24 | Disagree      |
| male   |  18 | Agree         |
| male   |  18 | Agree         |
| male   |  20 | Disagree      |
Analiza datelor din sondaje în Python

Analiza tiparelor de cheltuieli ale tinerilor cu Python
import pandas as pd
yp_crosstab = pd.crosstab(
  yp_survey['Gender'],
  yp_survey['Entertainment'])
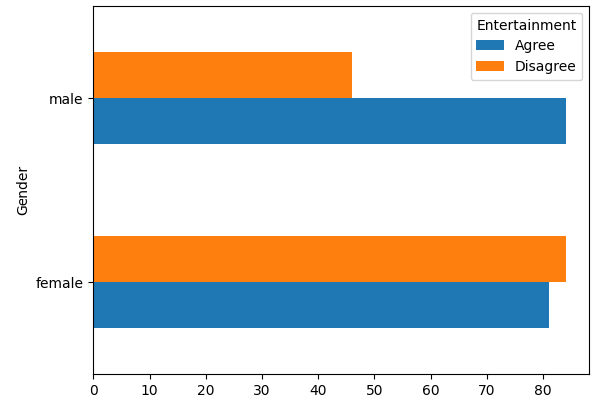
yp_crosstab
yp_crosstab.plot.barh()
|        | Agree | Disagree |
|--------|-------|----------|
| female |    81 |       84 |
| male   |    84 |       46 |

Analiza datelor din sondaje în Python

Analiza tiparelor de cheltuieli ale tinerilor cu Python

survey = yp_survey.groupby(['Gender', 'Entertainment'])['Age'].count().reset_index()

survey.columns = ['Gender', 'Entertainment', 'Respondents'] survey
| Gender | Entertainment | Respondents |
|--------|---------------|-------------|
| female | Agree         |          81 |
| female | Disagree      |          84 |
| male   | Agree         |          84 |
| male   | Disagree      |          46 |
Analiza datelor din sondaje în Python

Analiza tiparelor de cheltuieli ale tinerilor cu Python

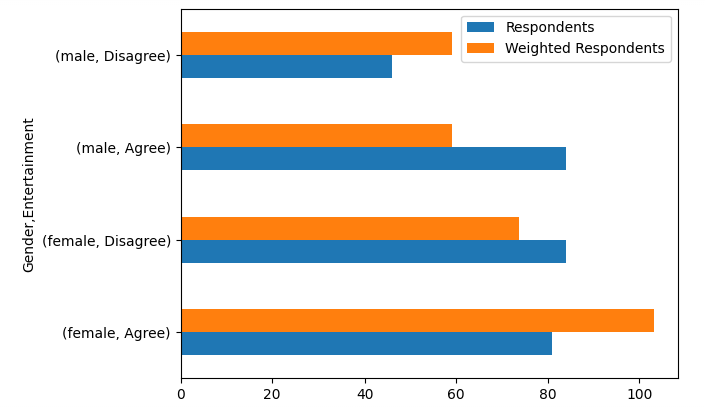
survey['% total respondents'] = survey.Respondents * 100./survey.Respondents.sum()
survey['% of population'] = [35, 25, 20, 20]
survey['Weight'] = survey['% of population']/survey['% total respondents']
survey['Weighted Respondents'] = survey.Weight * survey.Respondents
Analiza datelor din sondaje în Python

Analiza tiparelor de cheltuieli ale tinerilor cu Python

survey[['Gender','Entertainment',
        'Respondents','Weighted Respondents']].set_index(
  ['Gender','Entertainment']).plot.barh()

Analiza datelor din sondaje în Python

Să exersăm!

Analiza datelor din sondaje în Python

Preparing Video For Download...