Introduction to the data
Communicating with Data in the Tidyverse

Timo Grossenbacher
Data Journalist
This is me

The last step in the Tidyverse process

1 R for Data Science (http://r4ds.had.co.nz/communicate-intro.html)
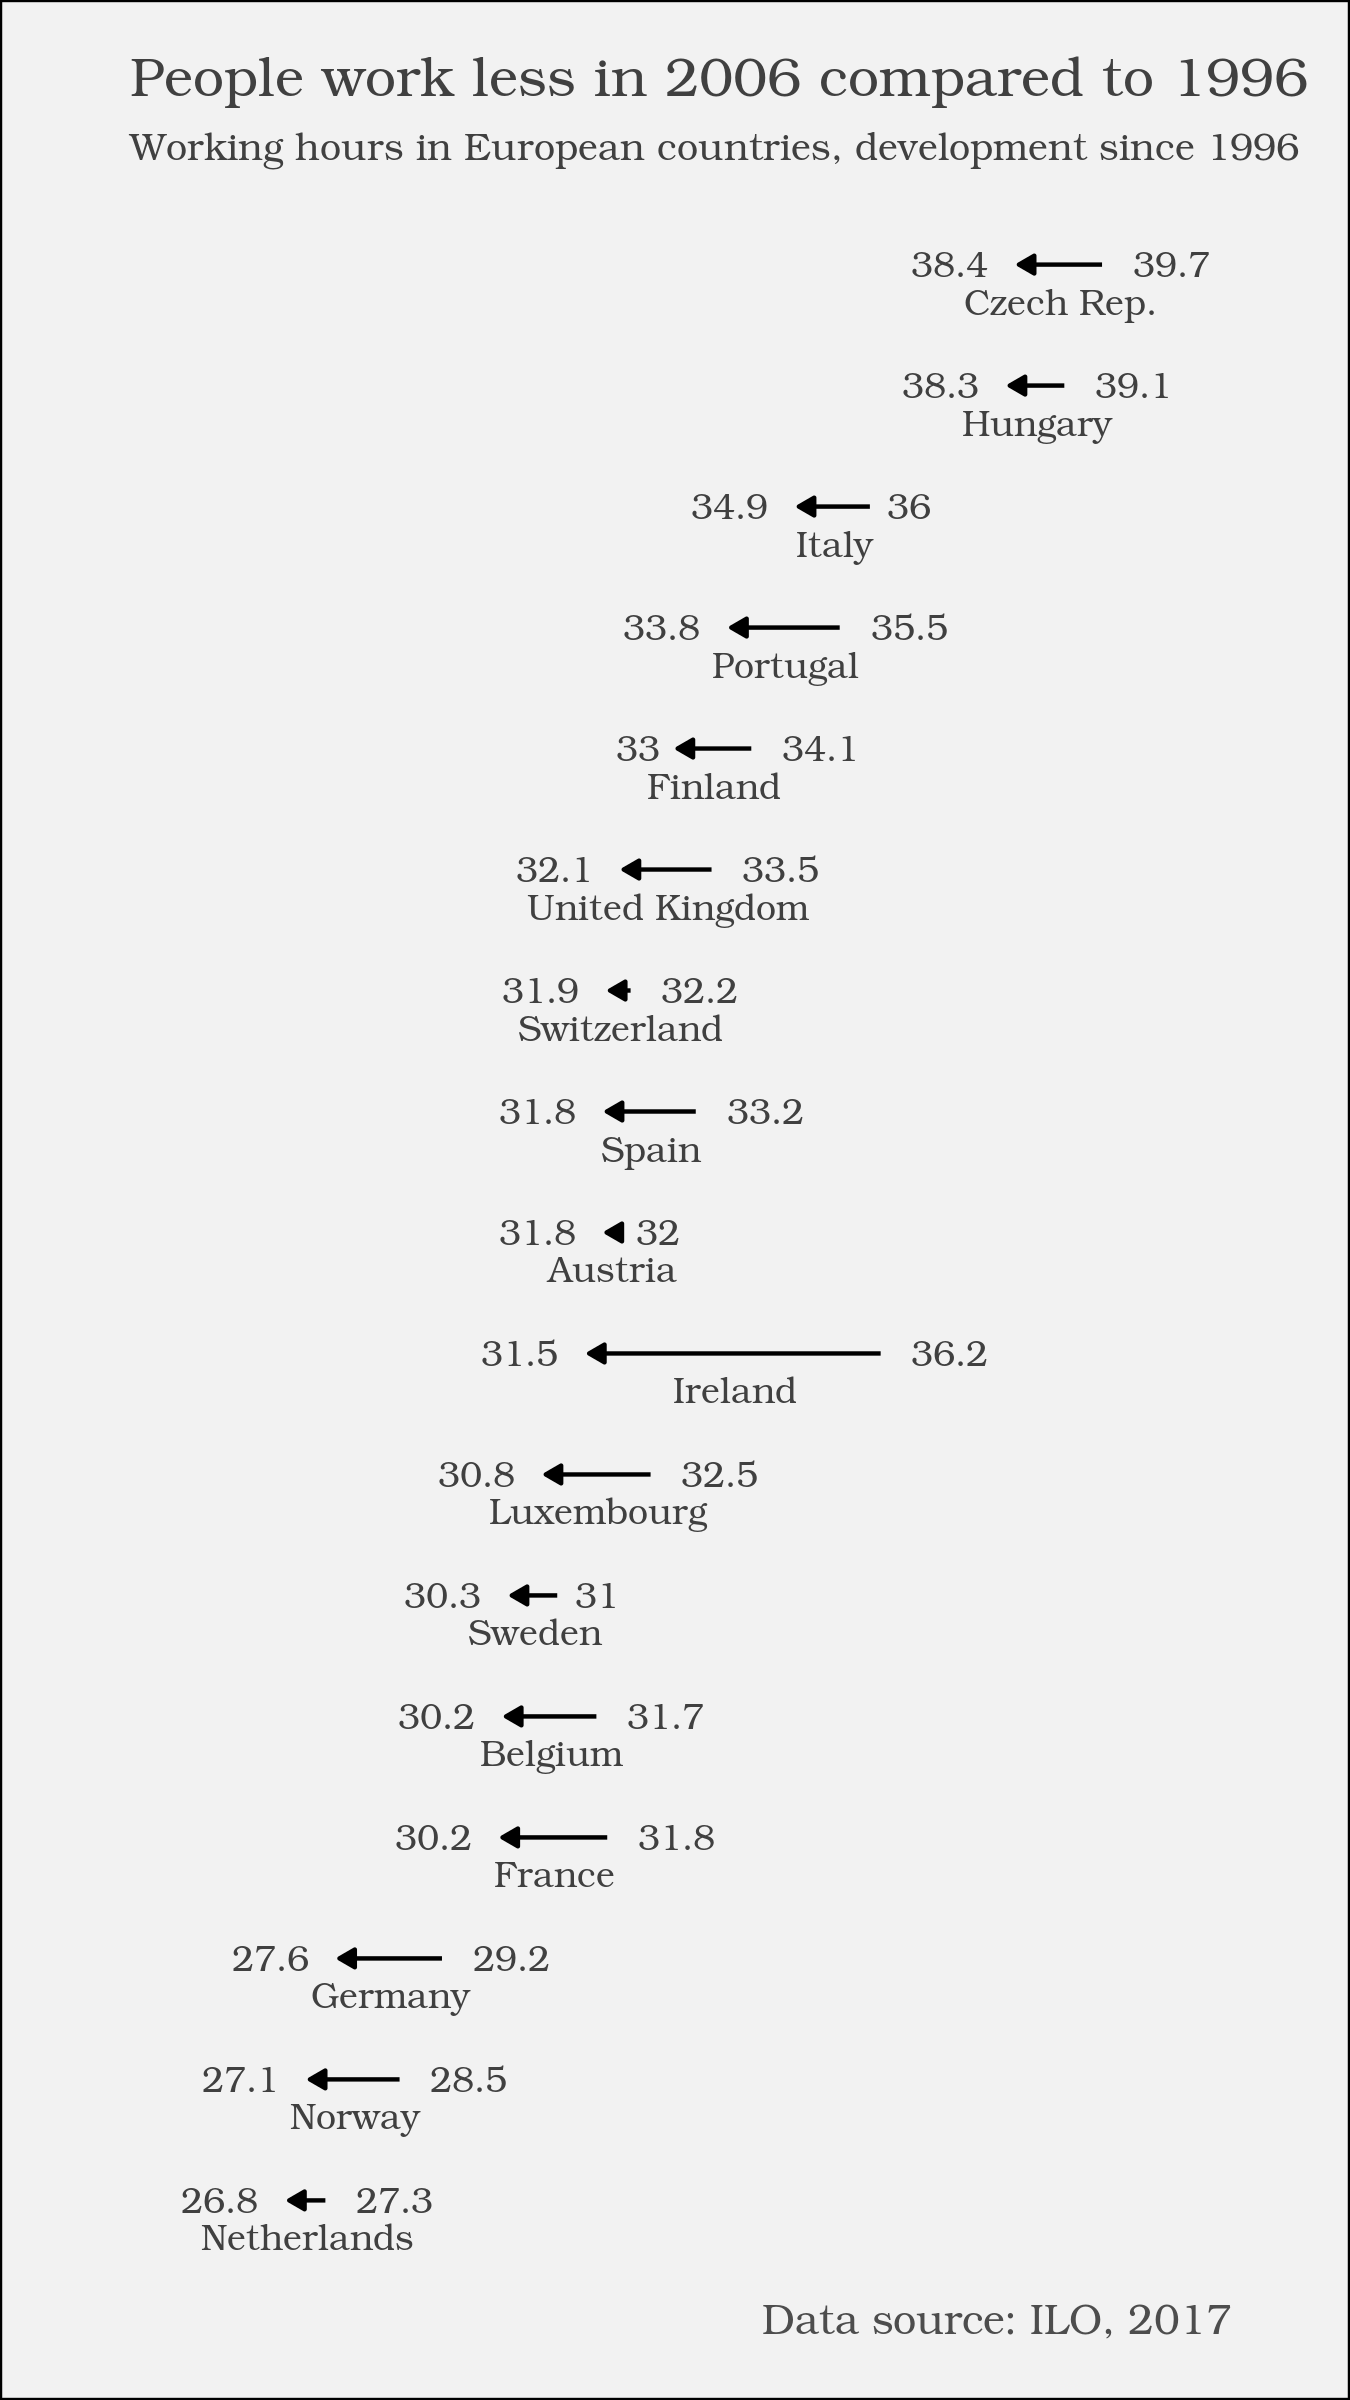
What you are going to create
The inner_join() verb / function
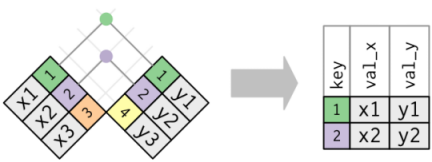
x %>%
  inner_join(y, by = "key")
#> # A tibble: 2 × 3
#>     key val_x val_y
#>   <dbl> <chr> <chr>
#> 1     1    x1    y1
#> 2     2    x2    y2
1 R for Data Science (http://r4ds.had.co.nz/relational-data.html#inner-join)

