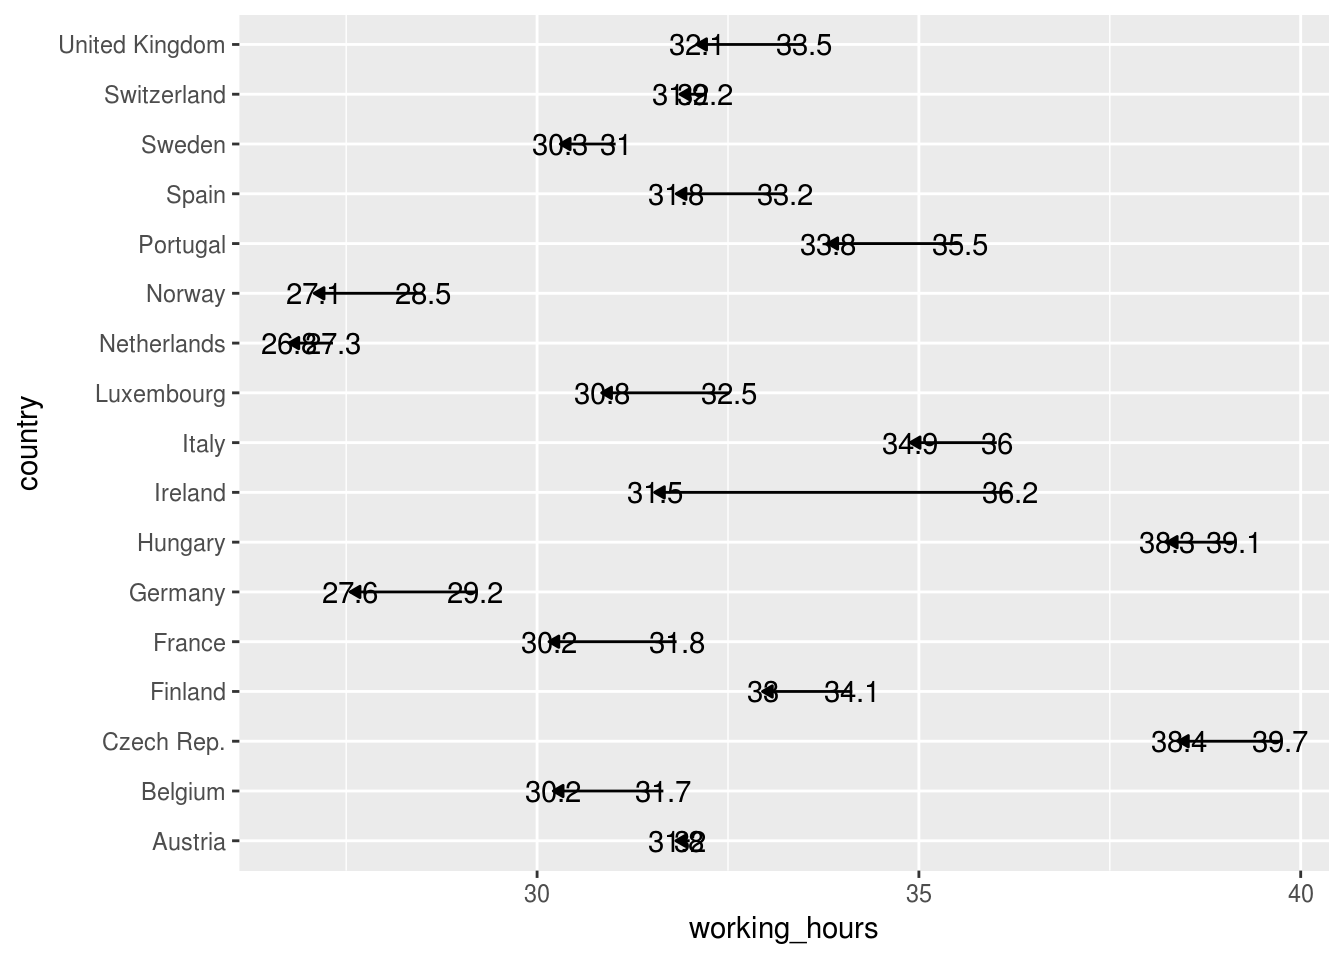
Polishing the dot plot
Communicating with Data in the Tidyverse

Timo Grossenbacher
Data Journalist
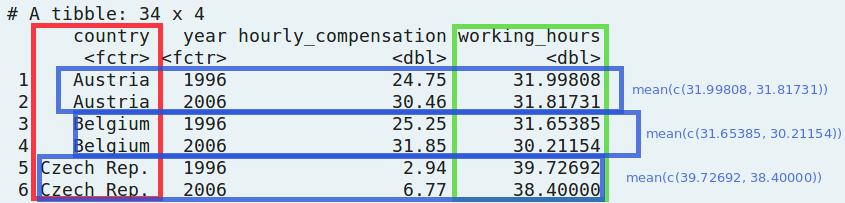
Reordering factors with the forcats package

1 Learn more at tidyverse.org (http://forcats.tidyverse.org/)

Communicating with Data in the Tidyverse
Timo Grossenbacher
Data Journalist

