Model Estimation and Likelihood
Introduction to Linear Modeling in Python

Jason Vestuto
Data Scientist
Estimation

Estimation
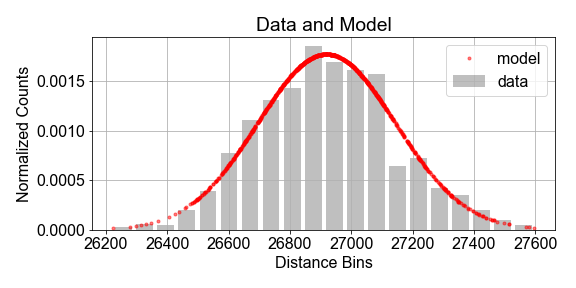
# Define gaussian model function
def gaussian_model(x, mu, sigma):
    coeff_part = 1/(np.sqrt(2 * np.pi * sigma**2))
    exp_part = np.exp( - (x - mu)**2 / (2 * sigma**2) )
    return coeff_part*exp_part
# Compute sample statistics
mean = np.mean(sample)
stdev = np.std(sample)
# Model the population using sample statistics
population_model = gaussian(sample, mu=mean, sigma=stdev)
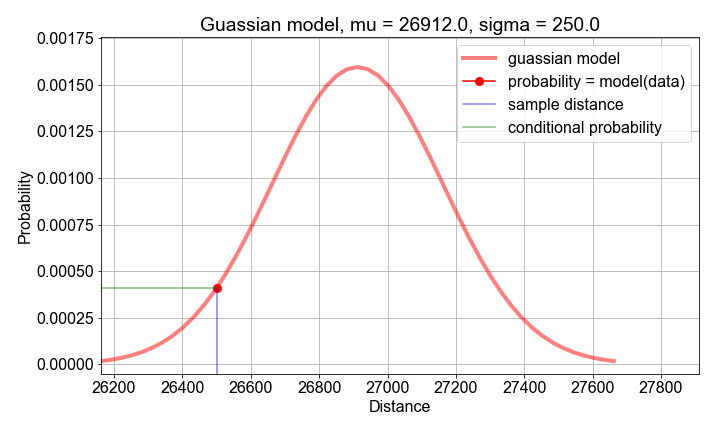
Likelihood vs Probability
- Conditional Probability: $P( \text{outcome A} | \text{given B})$
- Probability: $P( \text{data} | \text{model} )$
- Likelihood: $L( \text{model} | \text{data} )$
Computing Likelihood

Computing Likelihood

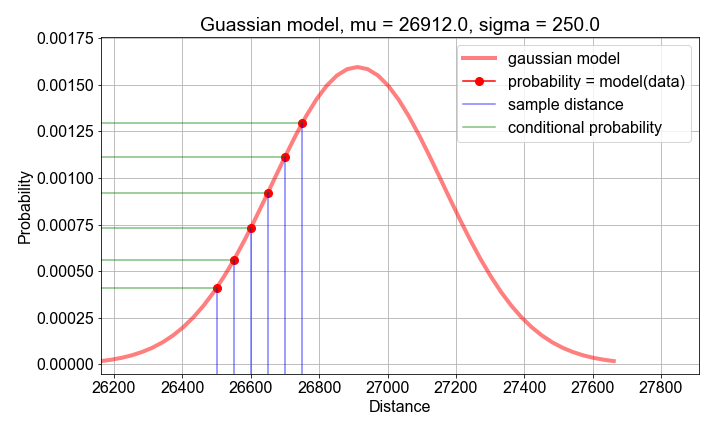
Likelihood from Probabilities
# Guess parameters
mu_guess = np.mean(sample_distances)
sigma_guess = np.std(sample_distances)
# For each sample point, compute a probability
probabilities = np.zeros(len(sample_distances))
for n, distance in enumerate(sample_distances):
    probabilities[n] = gaussian_model(distance, mu=mu_guess, sigma=sigma_guess)
likelihood = np.product(probs)
loglikelihood = np.sum(np.log(probs))
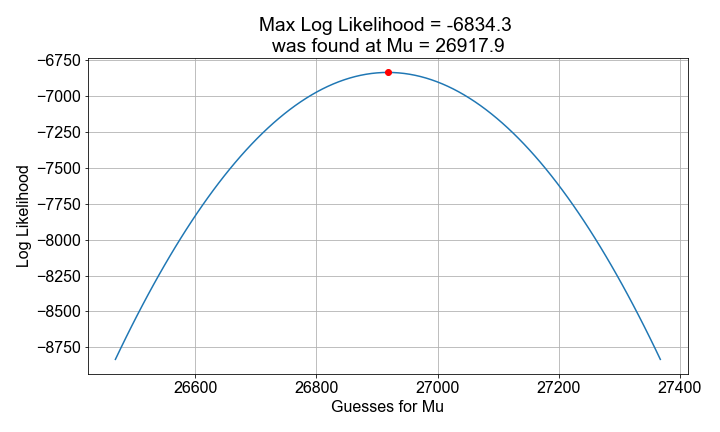
Maximum Likelihood Estimation
# Create an array of mu guesses
low_guess = sample_mean - 2*sample_stdev
high_guess = sample_mean + 2*sample_stdev
mu_guesses = np.linspace(low_guess, high_guess, 101)
# Compute the loglikelihood for each guess
loglikelihoods = np.zeros(len(mu_guesses))
for n, mu_guess in enumerate(mu_guesses):
    loglikelihoods[n] = compute_loglikelihood(sample_distances, mu=mu_guess, sigma=sample_stdev)
# Find the best guess
max_loglikelihood = np.max(loglikelihoods)
best_mu = mu_guesses[loglikelihoods == max_loglikelihood]
Maximum Likelihood Estimation

Let's practice!
Introduction to Linear Modeling in Python

