The Limits of Prediction
Introduction to Linear Modeling in Python

Jason Vestuto
Data Scientist
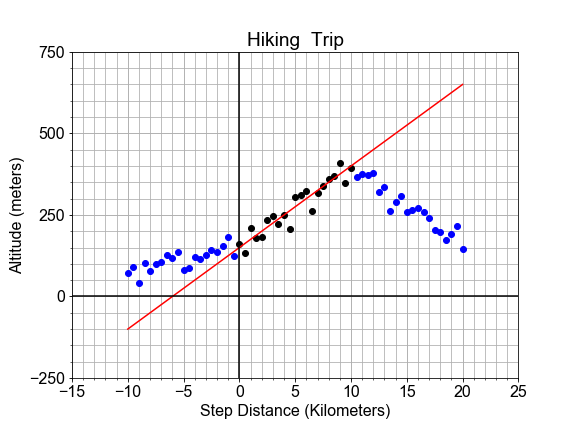
Interpolation
Interpolation
Interpolation
Interpolation
Interpolation
Extrapolating Too Far
Introduction to Linear Modeling in Python
Jason Vestuto
Data Scientist

