Quantifying Linear Relationships
Introduction to Linear Modeling in Python

Jason Vestuto
Data Scientist
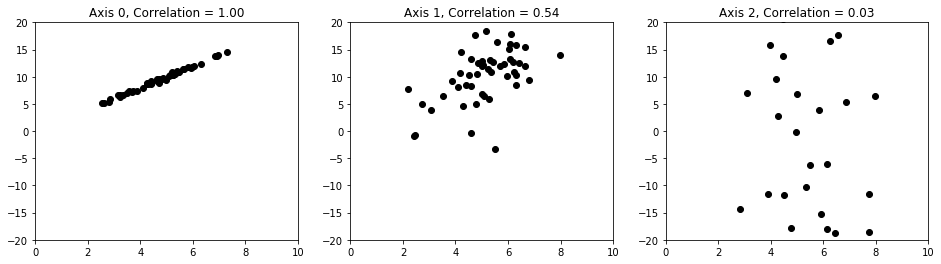
Pre-Visualization
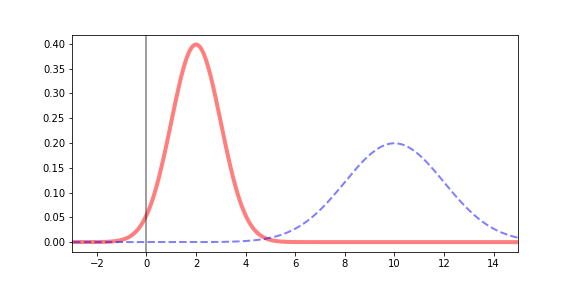
Normalization: Before
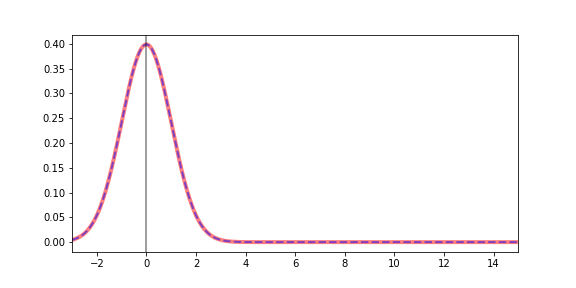
Normalization: After
Magnitude versus Direction
- Correlation values: -1 to +1
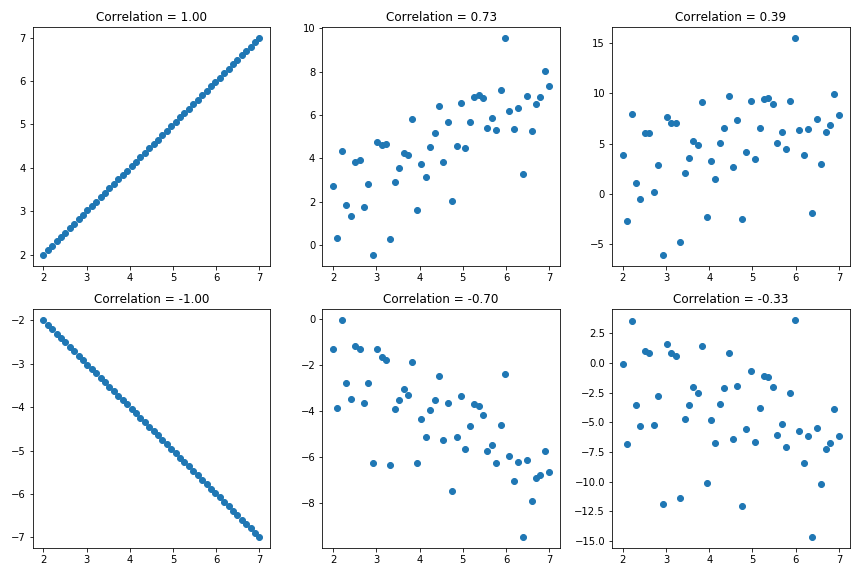
- Two Parts: Magnitude (1 to 0) versus Sign (+ or -)

