Model Errors and Randomness
Introduction to Linear Modeling in Python

Jason Vestuto
Data Scientist
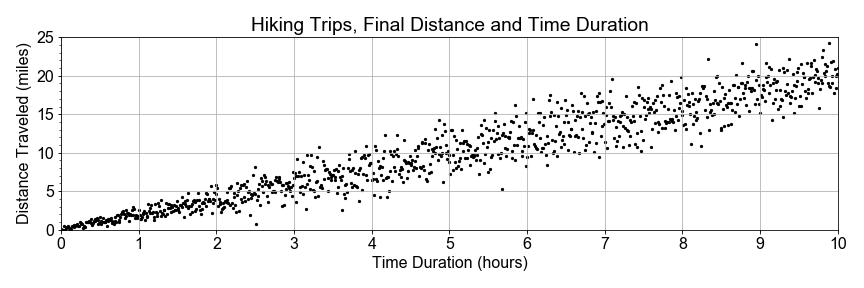
Ordered Data
Grouping Data

Grouping Data
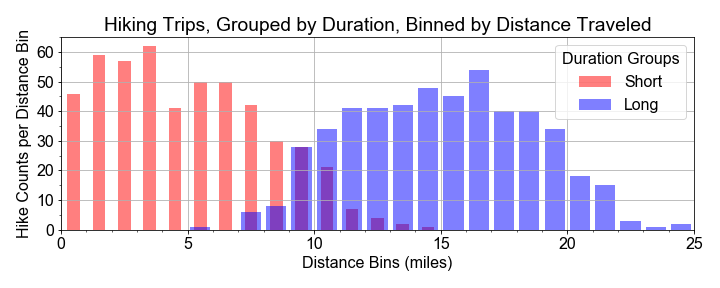
- Short Duration Group, mean = 5
- Long Duration Group, mean = 15
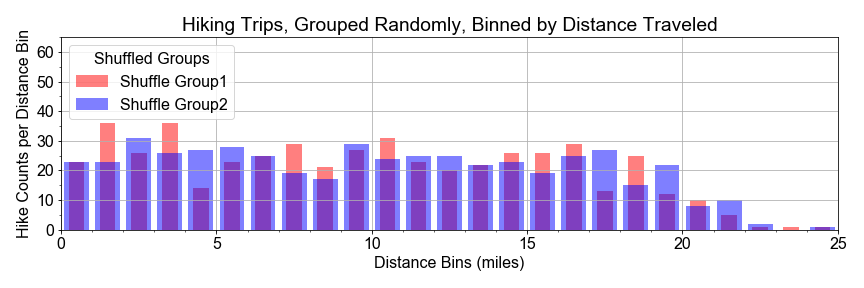
Shuffle and Regrouping
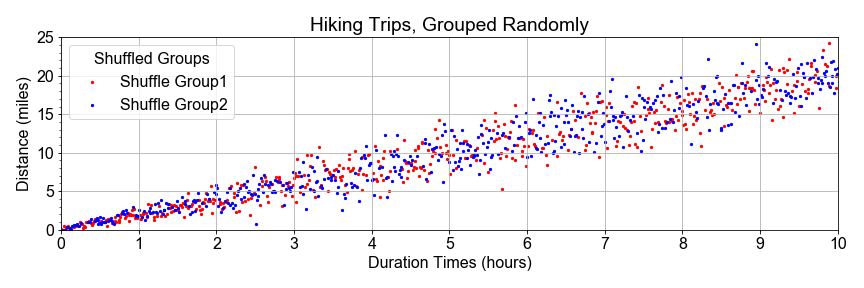
Shuffling and Regrouping
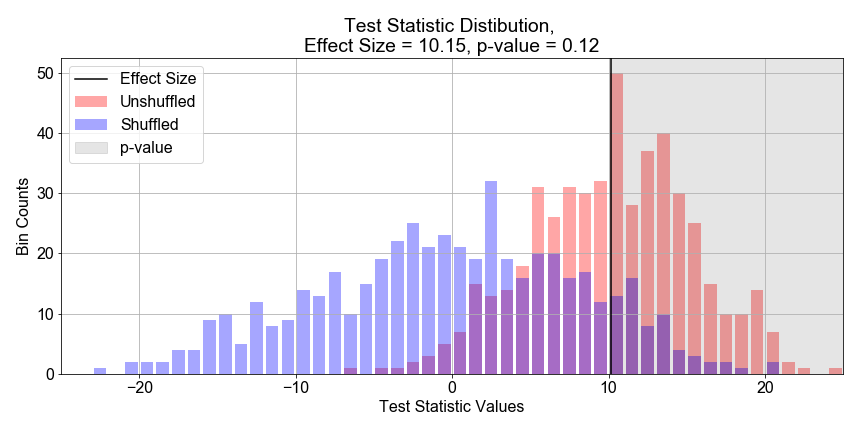
p-Value