Least-Squares Optimization

Introduction to Linear Modeling in Python

Jason Vestuto

Data Scientist

Minima of RSS

Plot of RSS y-axis values versus slope x-axis values, shaped as an up-turned parabola or well, with minimum at the bottom near slope=25

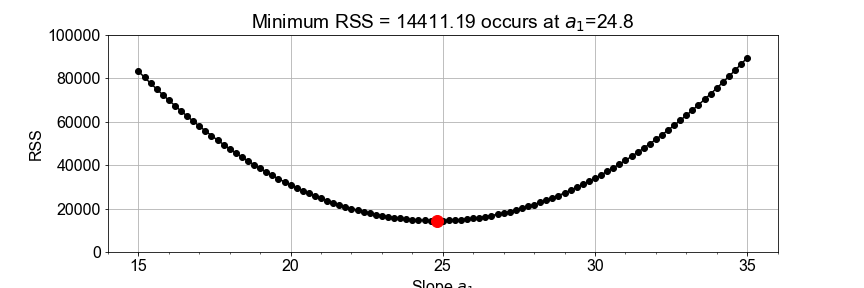
Setting RSS slope = zero, and some calculus, yields:

  • $a_1 = covariance(x, y) / variance(x) $
  • $a_0 = mean(y) - a_1 \times mean(x) $
Introduction to Linear Modeling in Python

Optimized by Numpy

Numpy expressions of optimal slope and intercept

x_mean = np.mean(x)
y_mean = np.mean(y)
x_dev = x - x_mean
y_dev = y - y_mean
a1 = np.sum( x_dev * y_dev ) / np.sum( x_dev**2 )
a0 = y_mean - (a1*x_mean)
Introduction to Linear Modeling in Python

Optimized by Scipy

from scipy import optimize
x_data, y_data  = load_data()
def model_func(x, a0, a1):
    return a0 + (a1*x)
param_opt, param_cov = optimize.curve_fit(model_func, x_data, y_data)
a0 = param_opt[0]  # a0 is the intercept in y = a0 + a1*x
a1 = param_opt[1]  # a1 is the slope     in y = a0 + a1*x
Introduction to Linear Modeling in Python

Optimized by Statsmodels

from statsmodels.formula.api import ols
x_data, y_data = load_data()
df = pd.DataFrame(dict(x_name=x_data, y_name=y_data))
model_fit = ols(formula="y_name ~ x_name", data=df).fit()
y_model = model_fit.predict(df)
x_model = x_data
a0 = model_fit.params['Intercept']
a1 = model_fit.params['x_name']
Introduction to Linear Modeling in Python

Let's practice!

Introduction to Linear Modeling in Python

Preparing Video For Download...