Visualizing Linear Relationships
Introduction to Linear Modeling in Python

Jason Vestuto
Data Scientist
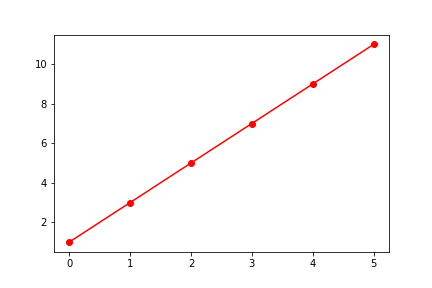
Quick Plots
import matplotlib.pyplot as plt
plt.plot(x, y, 'r-o')
plt.show()
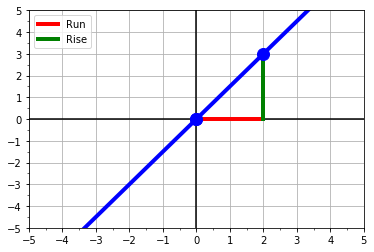
Visualizing Linear Data
Introduction to Linear Modeling in Python
Jason Vestuto
Data Scientist
import matplotlib.pyplot as plt
plt.plot(x, y, 'r-o')
plt.show()

