What makes a model linear
Introduction to Linear Modeling in Python

Jason Vestuto
Data Scientist
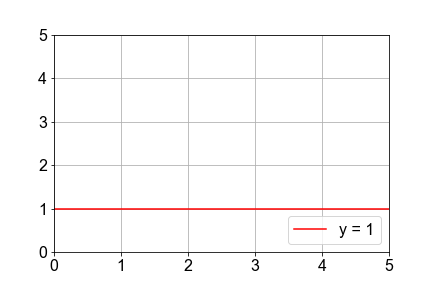
Series Terms: a0=1
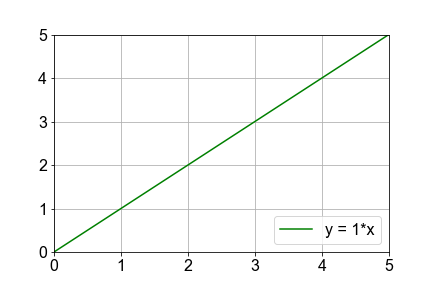
Series Terms: a1=1
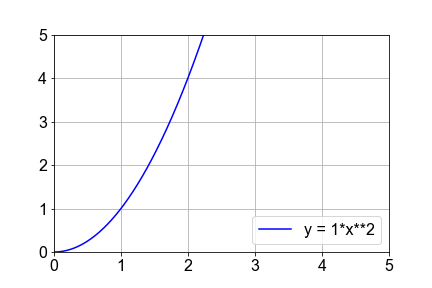
Series Terms: a2=1
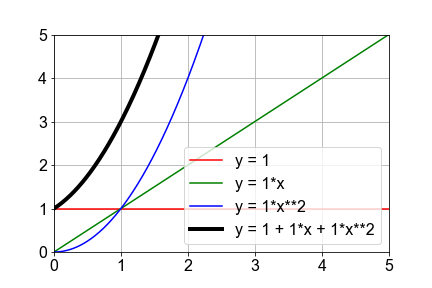
Combining all Terms
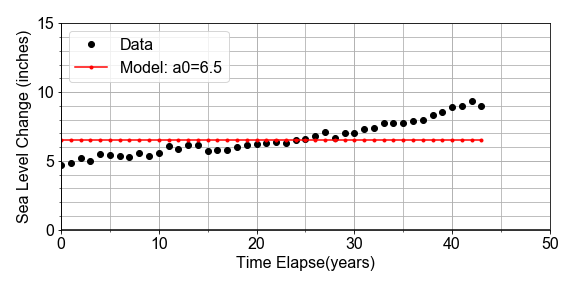
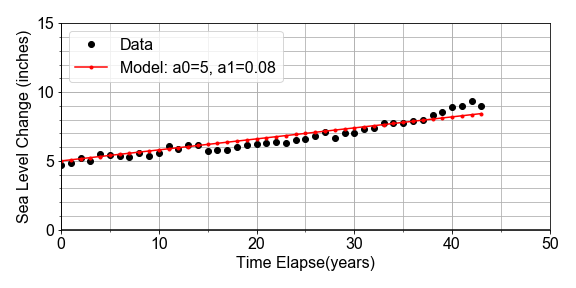
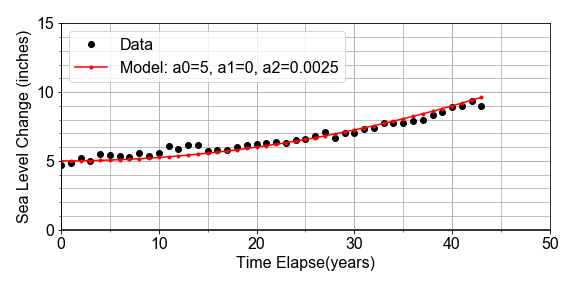
Real Data

Zeroth Order
First Order
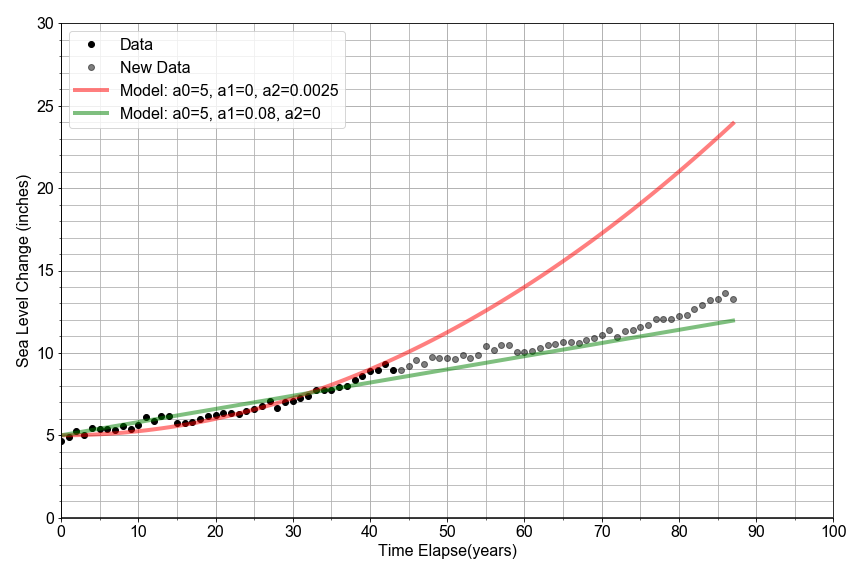
Higher Order
Over-fitting
Introduction to Linear Modeling in Python
Jason Vestuto
Data Scientist

