Сравнение метрик и графиков в DVC

CI/CD для машинного обучения

Ravi Bhadauria

Machine Learning Engineer

Настройка YAML-файла DVC

  • Настройте YAML-файл DVC для отслеживания метрик по экспериментам
  • Замените outs
stages:
  preprocess:
    ...
  train:
    ...
    outs:
    - metrics.json
    - confusion_matrix.png
  • На metrics
stages:
  preprocess:
    ...
  train:
    ...
    outs:
    - confusion_matrix.png

metrics: - metrics.json: cache: false
CI/CD для машинного обучения

Просмотр и сравнение метрик DVC

-> dvc metrics show

Path accuracy f1_score precision recall metrics.json 0.947 0.8656 0.988 0.7702

Измените гиперпараметр и перезапустите dvc repro

-> dvc metrics diff

Path Metric HEAD workspace Change metrics.json accuracy 0.947 0.9995 0.0525 metrics.json f1_score 0.8656 0.9989 0.1333 metrics.json precision 0.988 0.9993 0.0113 metrics.json recall 0.7702 0.9986 0.2284
1 https://dvc.org/doc/command-reference/metrics
CI/CD для машинного обучения

Настройка GitHub Action для DVC

  • Добавьте GitHub Action setup-dvc
  • Замените запуск скриптов Python на пайплайн DVC
steps:
  ...
  - name: Setup DVC
    uses: iterative/setup-dvc@v1

- name: Run DVC pipeline run: dvc repro
CI/CD для машинного обучения

Настройка GitHub Action для DVC

- name: Write CML report
  env:
    REPO_TOKEN: ${{ secrets.GITHUB_TOKEN }}
  run: |
    # Print metrics of current branch
    dvc metrics show --md >> report.md

# Compare metrics with main branch git fetch --prune dvc metrics diff --md main >> report.md
# Create CML report cml comment create report.md
CI/CD для машинного обучения

Пайплайн в действии

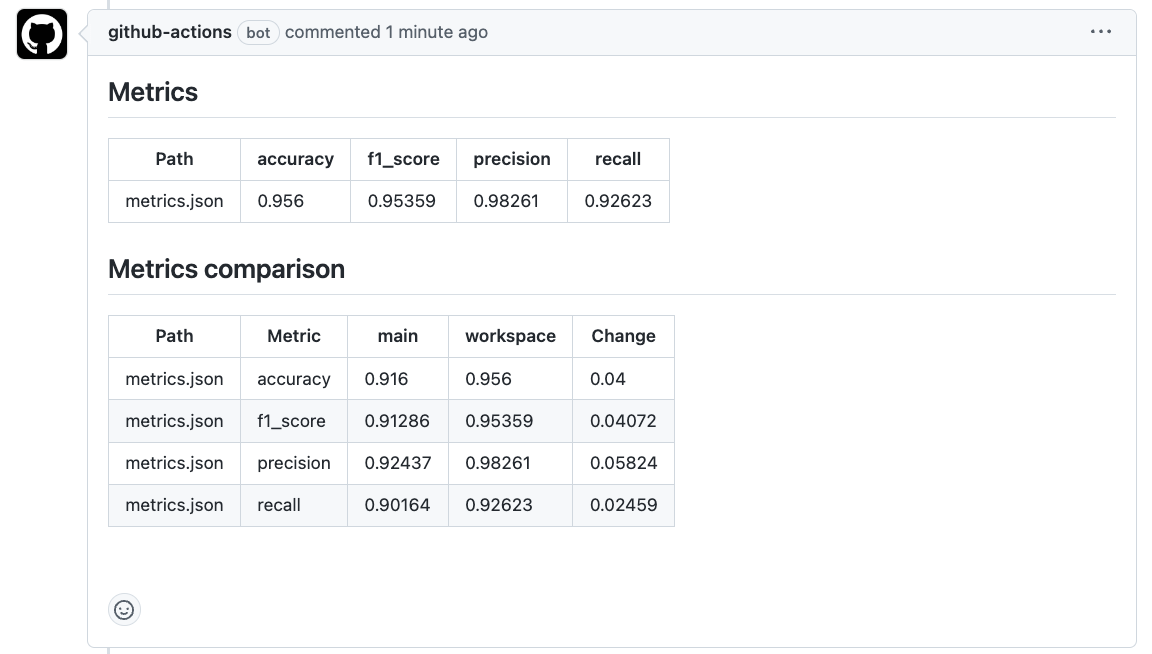
Скриншот комментария к пул-реквесту с различиями метрик относительно ветки main

CI/CD для машинного обучения

Типы графиков в DVC

  • scatter – точечная диаграмма
  • linear – интерактивный линейный график
  • simple – неинтерактивный настраиваемый линейный график
  • smooth – линейный график со сглаживанием
  • confusion – матрица ошибок
  • confusion_normalized – матрица ошибок с нормализацией значений в диапазон <0, 1>
  • bar_horizontal – горизонтальная столбчатая диаграмма
  • bar_horizontal_sorted – горизонтальная столбчатая диаграмма, отсортированная по размеру столбцов
1 https://dvc.org/doc/user-guide/experiment-management/visualizing-plots#plot-templates-data-series-only
CI/CD для машинного обучения

Настройка dvc.yaml для графиков

stages:
  train:
    ...
    plots:
    - predictions.csv: # Name of file containing predictions
        template: confusion # Style of plot

x: predicted_label # X-axis column name in csv file y: true_label # Y-axis column name in csv file x_label: 'Predicted label' y_label: 'True label' title: Confusion matrix
cache: false # Save in Git
CI/CD для машинного обучения

Построение матрицы ошибок

-> dvc plots show predictions.csv
file:///path/to/index.html

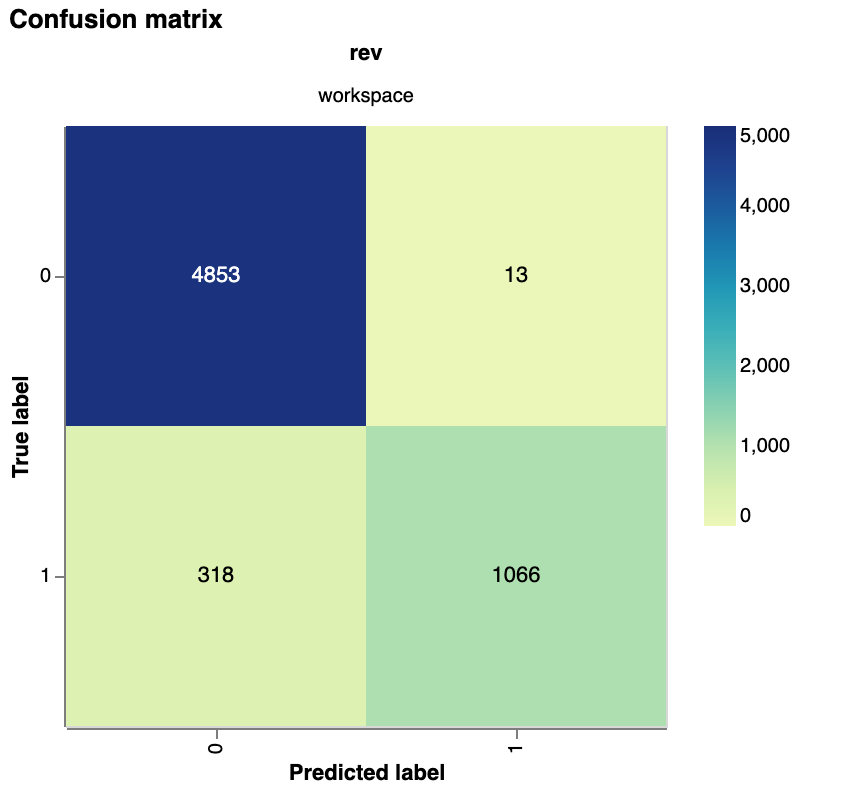
График матрицы ошибок, построенный с помощью DVC

CI/CD для машинного обучения

Сравнение матриц ошибок

-> dvc plots diff --target predictions.csv main
file:///path/to/index.html

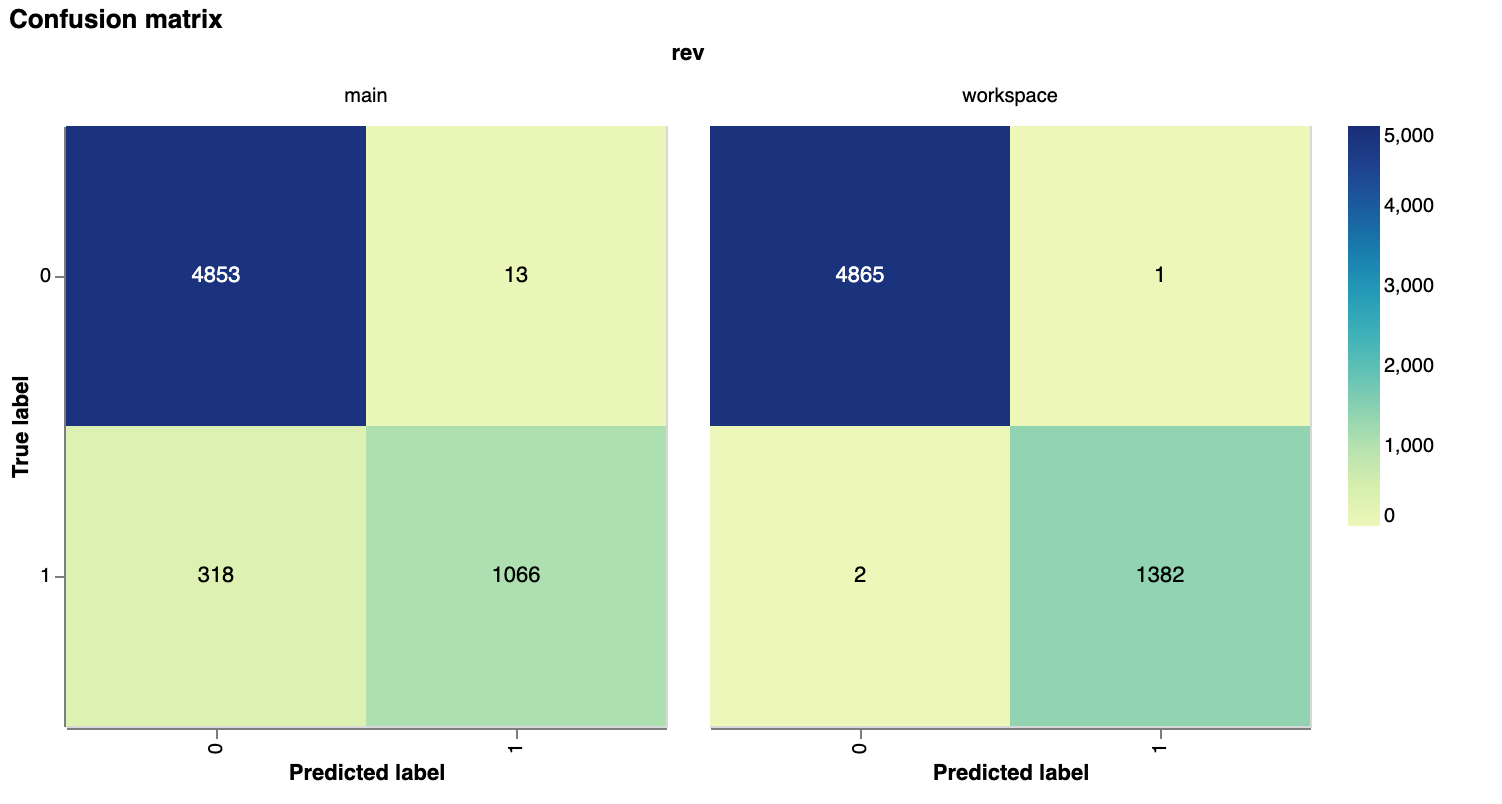
График сравнения матриц ошибок, построенный с помощью DVC

CI/CD для машинного обучения

Сравнение ROC-кривых

# Changes in Python
y_proba = model.predict_proba(X_test)
fpr, tpr, _ = roc_curve(y_test, 
                        y_proba[:, 1])
# Changes in dvc.yaml
plots:
- roc_curve.csv:
    template: simple
    x: fpr
    y: tpr
    x_label: 'False Positive Rate'
    y_label: 'True Positive Rate'
    title: ROC curve
    cache: false

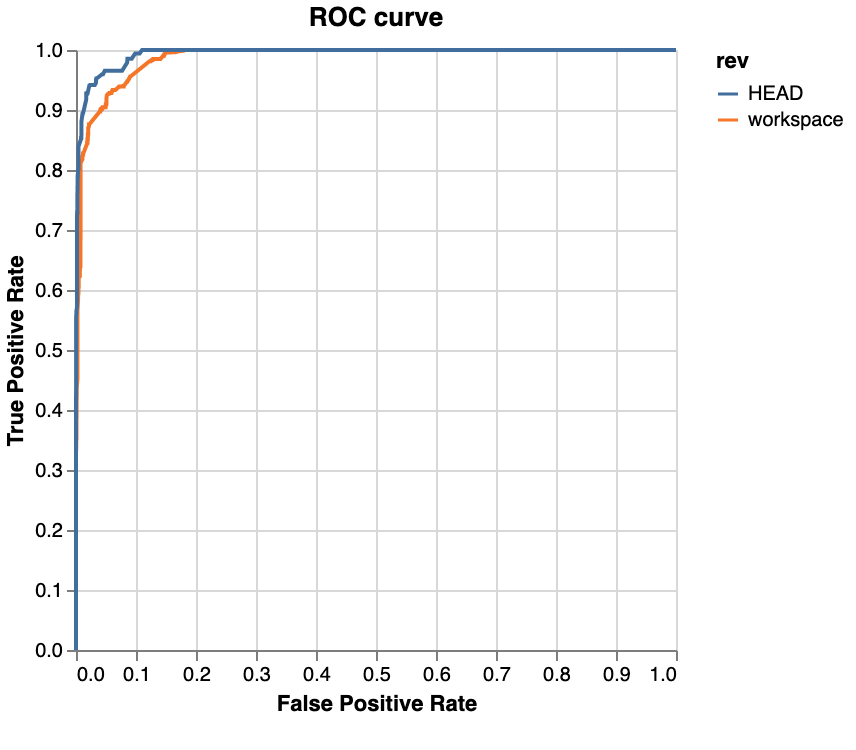
График сравнения ROC-кривых, построенный с помощью DVC

CI/CD для машинного обучения

Давайте потренируемся!

CI/CD для машинного обучения

Preparing Video For Download...