Добро пожаловать на курс!
Статистический вывод для числовых данных в R

Mine Cetinkaya-Rundel
Associate Professor of the Practice, Duke University
Аренда в Манхэттене
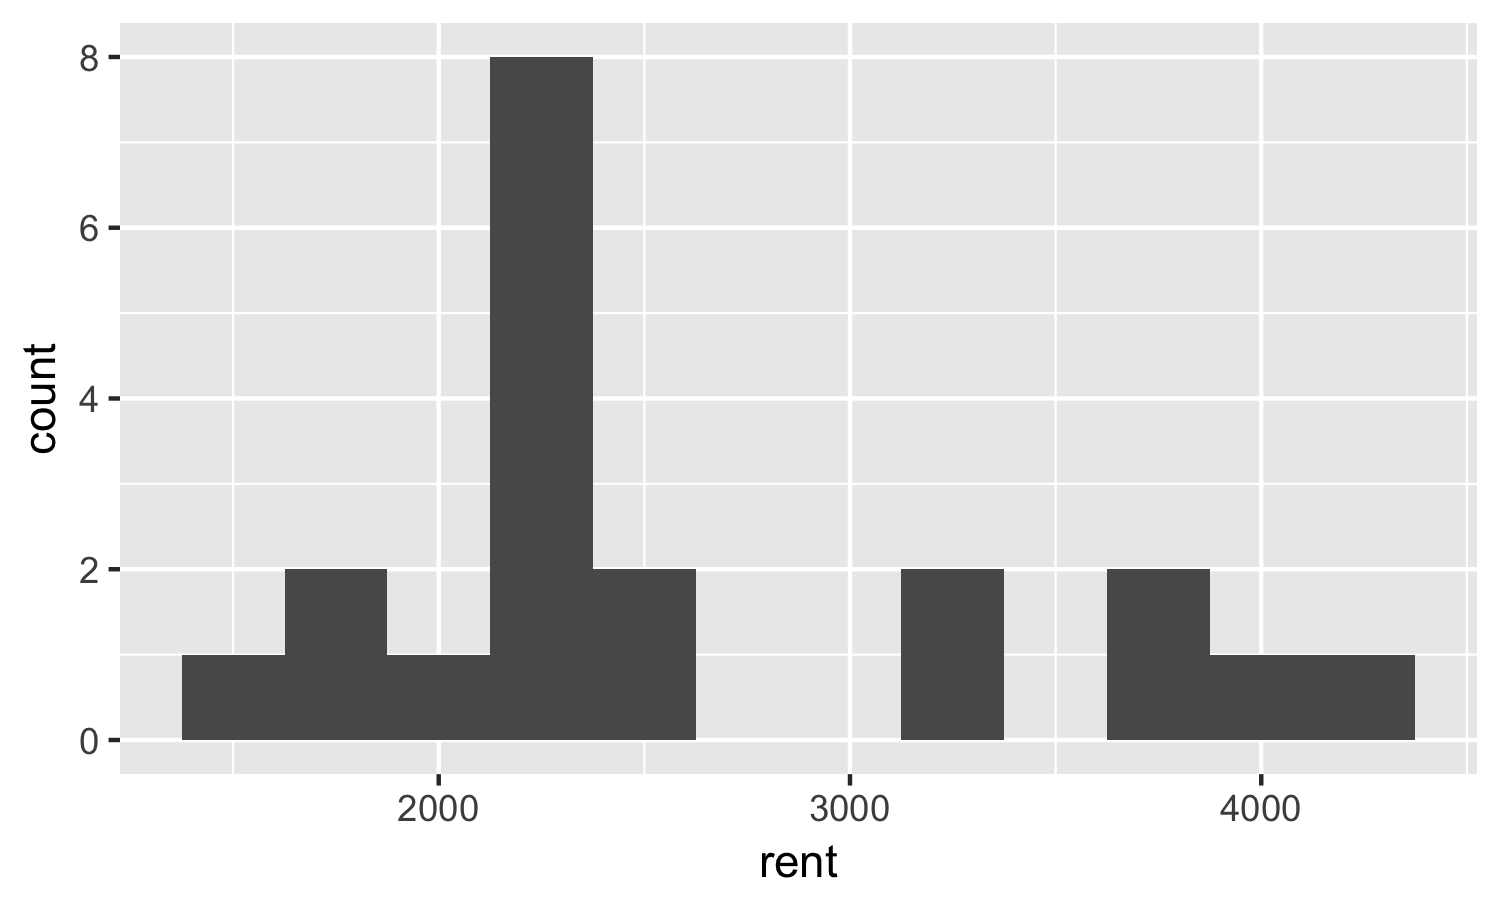
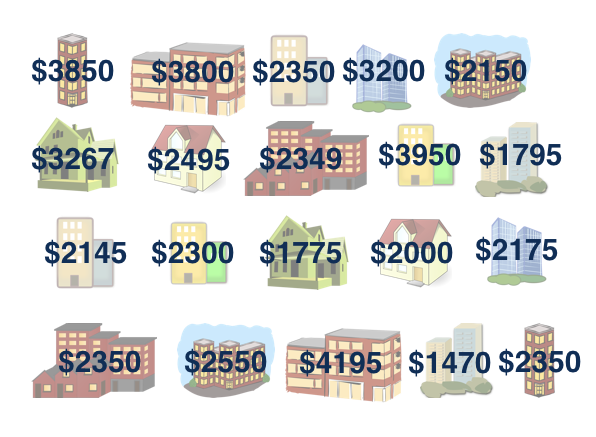
Наблюдаемая выборка
медиана выборки = $2 350
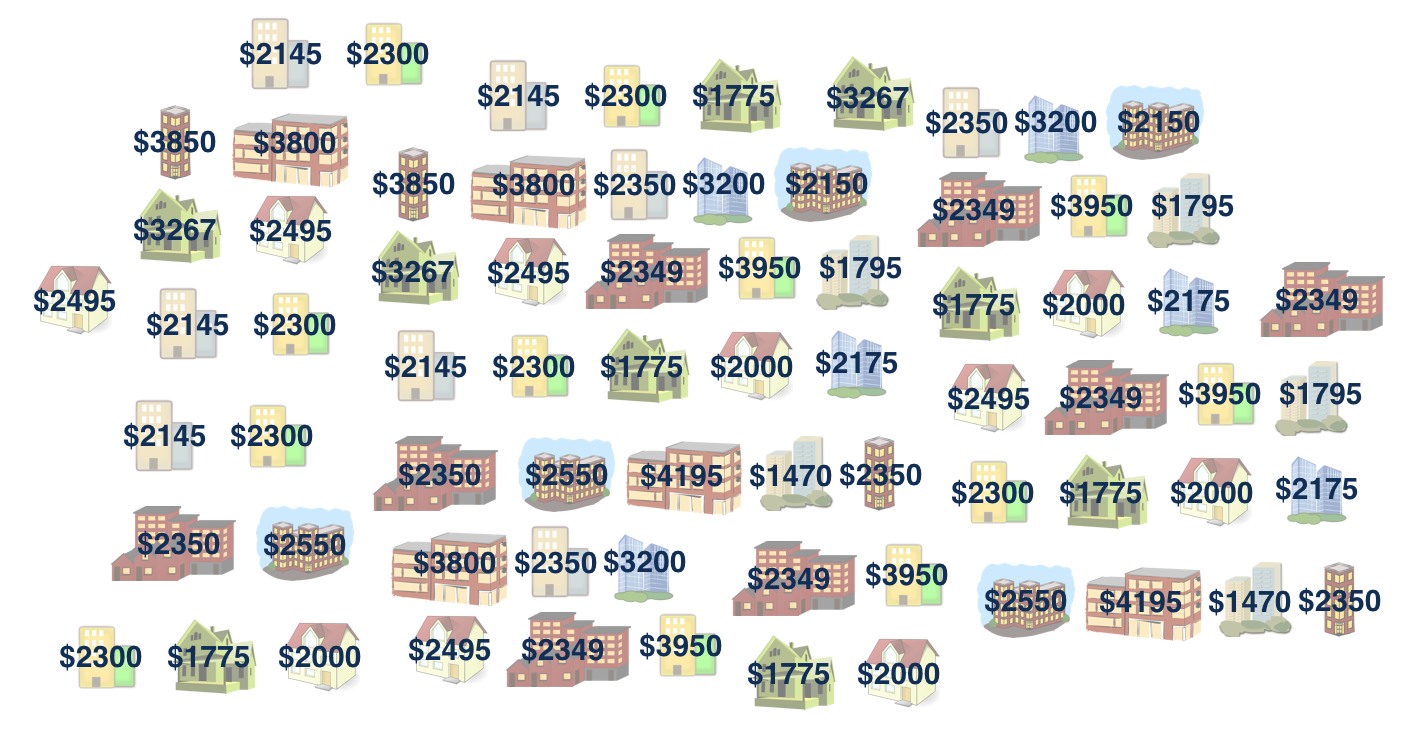
Бутстрэп-генеральная совокупность
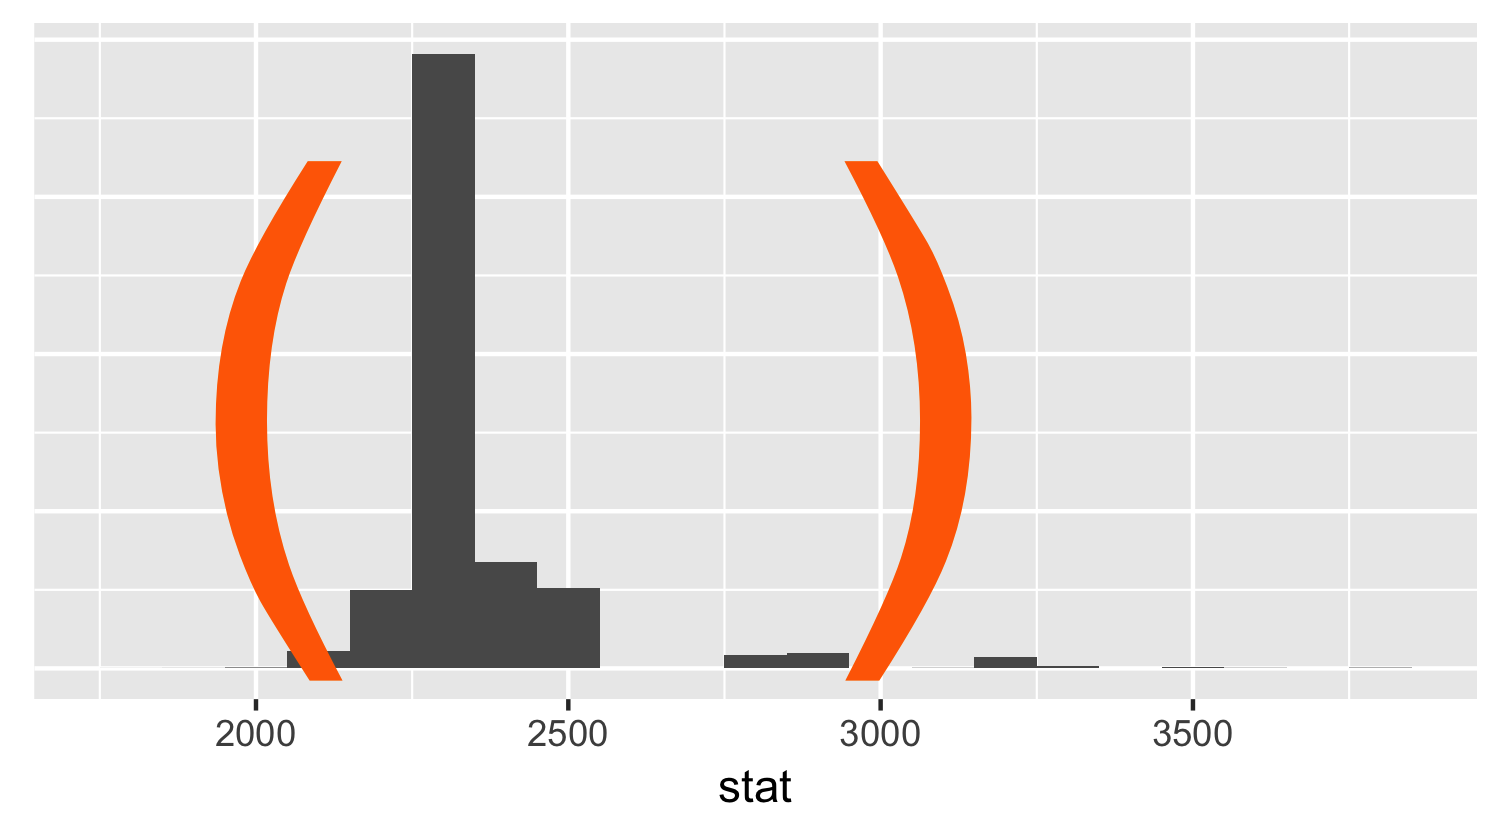
Построение бутстрэп-интервала
library(infer)

___ %>%                               # start with data frame
  specify(response = ___) %>%         # specify the variable of interest
generate(reps = ___, type = "bootstrap") %>% # generate bootstrap samples
calculate(stat = "___") # calculate bootstrap statistic
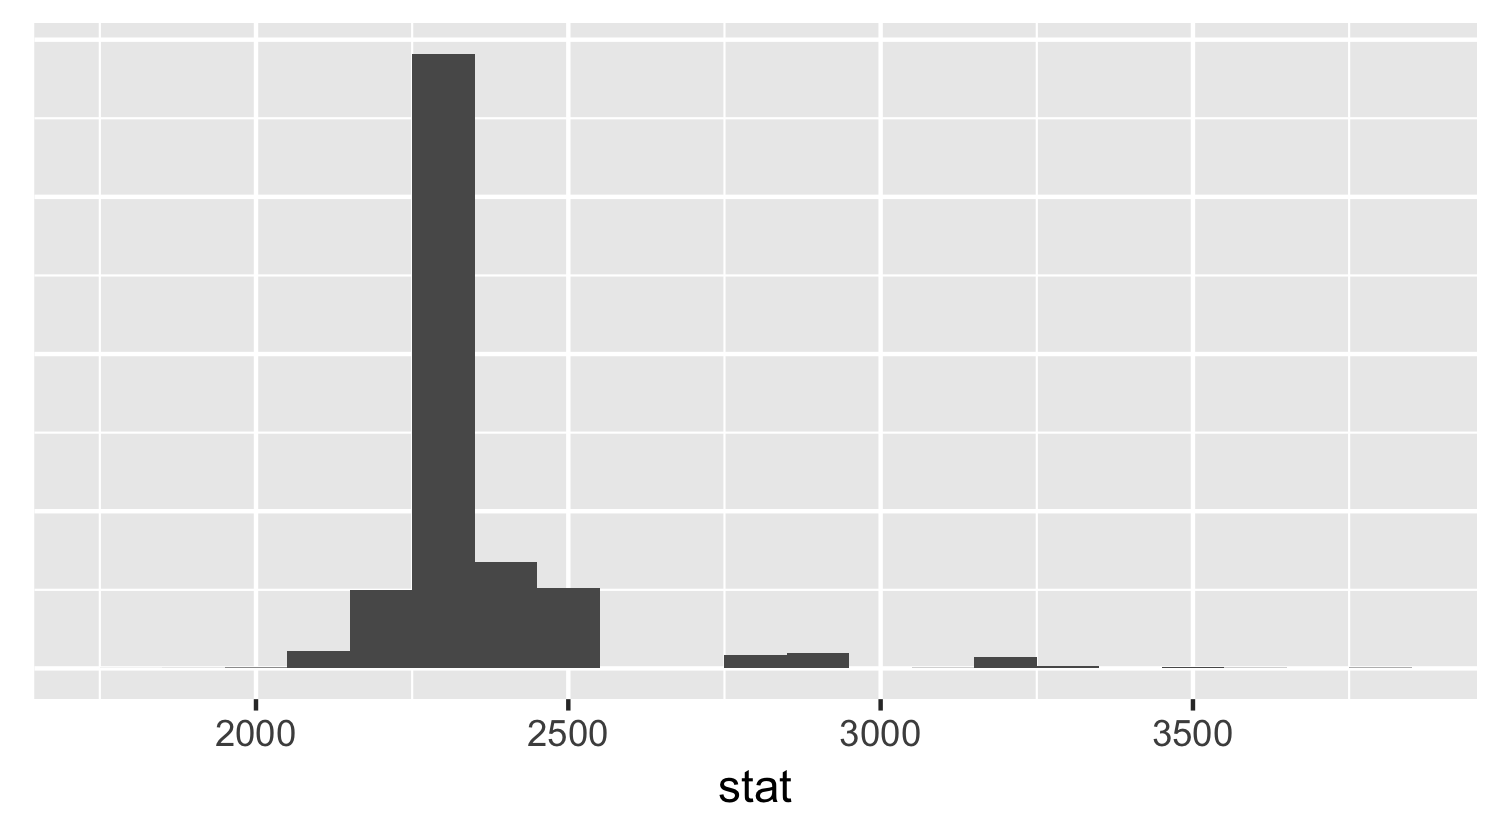
Построение бутстрэп-интервала
library(infer)

___ %>%                               # start with data frame
  specify(response = ___) %>%         # specify the variable of interest
  generate(reps = ___, type = "bootstrap") %>%  # generate bootstrap samples
calculate(stat = "___") # calculate bootstrap statistic