Использование переменных развития

Средний уровень прогностической аналитики на Python

Nele Verbiest

Senior Data Scientist @PythonPredictions

Построение прогностических моделей

# Import the linear_model module
from sklearn import linear_model

# Predictive variables variables = ["gender","age", "donations_last_year", "ratio_month_year"]
# Select predictors and target X = basetable[variables] y = basetable[["target"]]
# Construct the logistic regression model logreg = linear_model.LogisticRegression() logreg.fit(X, y)
Средний уровень прогностической аналитики на Python

Получение прогнозов

# Import the linear_model module
from sklearn import linear_model

# Predictive variables variables = ["gender","age", "donations_last_year", "ratio_month_year"]
# Select predictors and target X = basetable[variables] y = basetable[["target"]]
# Construct the logistic regression model logreg = linear_model.LogisticRegression() logreg.fit(X, y)
# Make predictions
predictions = logreg.predict_proba(X)[:,1]
Средний уровень прогностической аналитики на Python

Оценка прогностических моделей с помощью AUC

# Import roc_auc_score module from sklearn.metrics
from sklearn.metrics import roc_auc_score

# Calculate the AUC auc= roc_auc_score(y, predictions) print(round(auc,2))
0.56
Средний уровень прогностической аналитики на Python

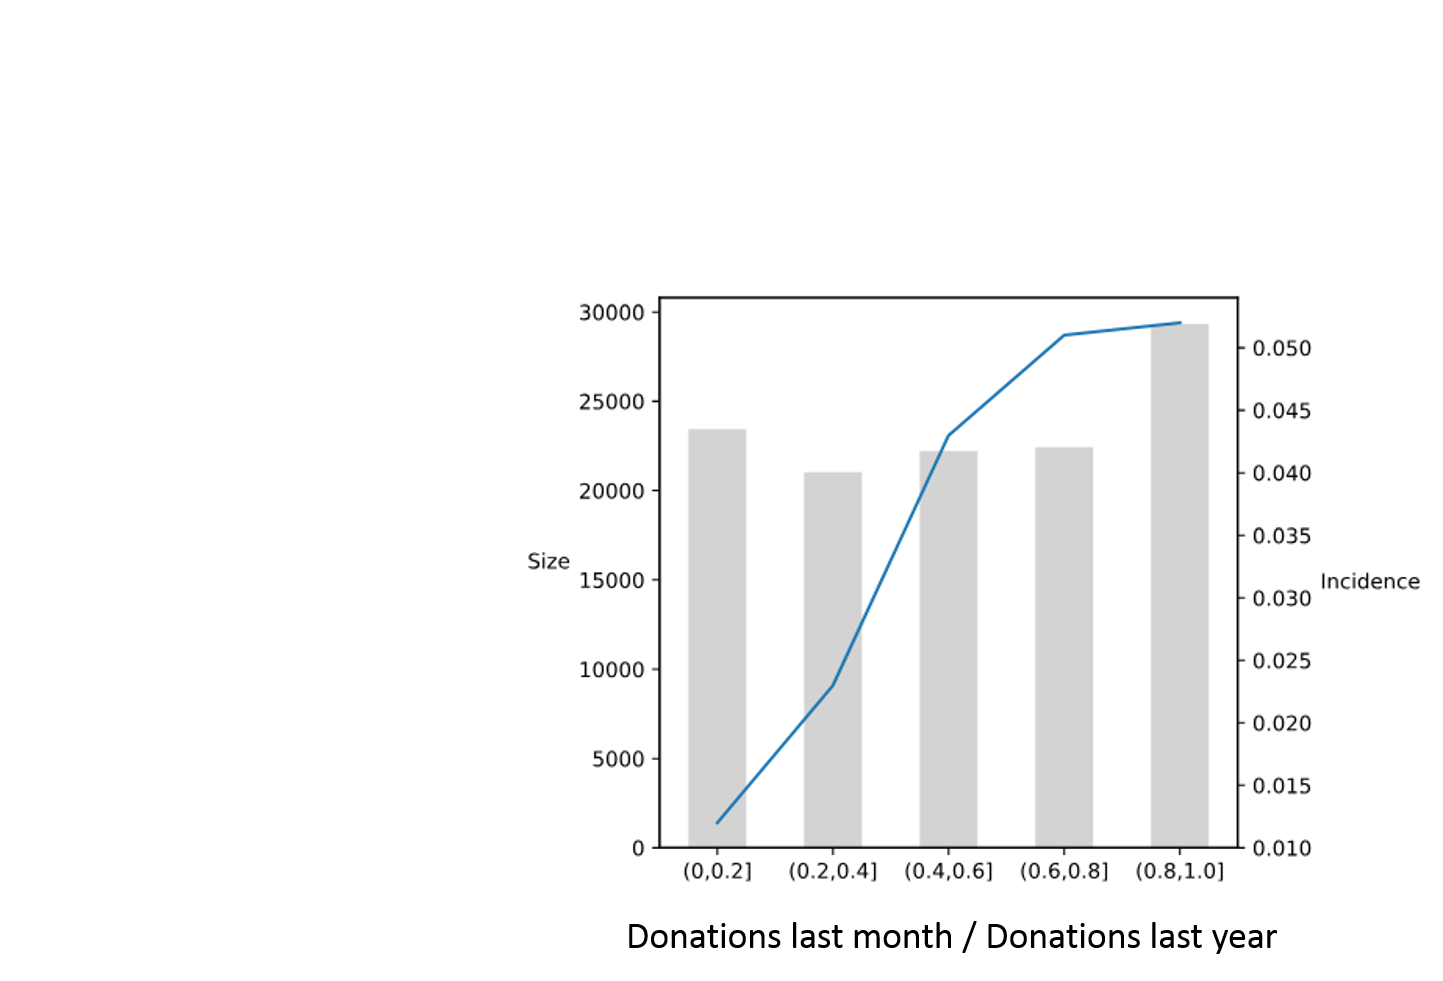
График анализа предиктора

# Discretize the variable in 5 bins and add to the basetable
basetable["ratio_month_year_disc"] = pd.qcut(basetable["ratio_month_year"], 5)

# Construct the predictor insight graph table pig_table = create_pig_table(basetable, "target","ratio_month_year_disc") ```{python} # Plot the predictor insight graph plot_pig(pig_table, "ratio_month_year_disc")
Средний уровень прогностической аналитики на Python

Интерпретация графика анализа предиктора
Средний уровень прогностической аналитики на Python

Давайте потренируемся!

Средний уровень прогностической аналитики на Python

Preparing Video For Download...