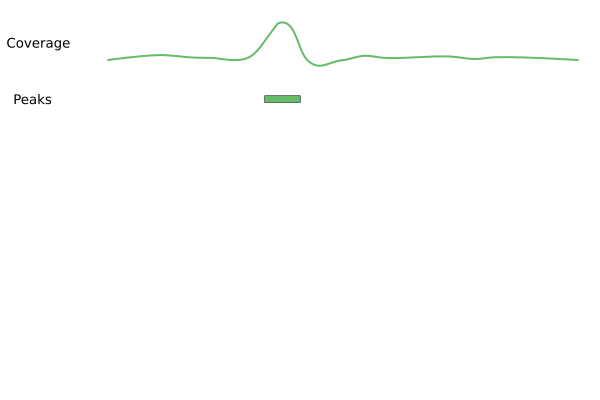
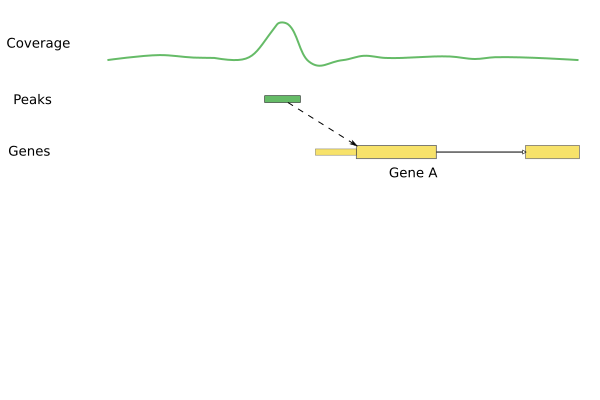
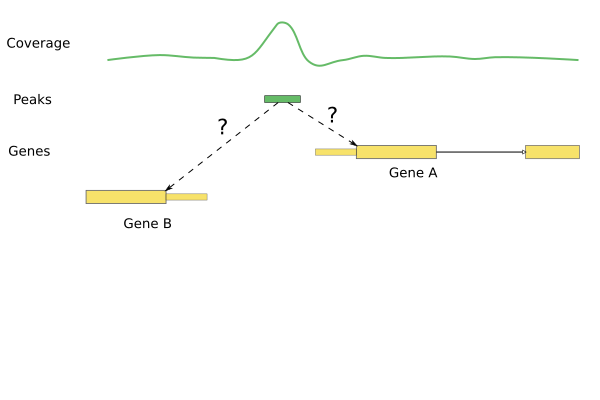
Interpreting ChIP-seq peaks

ChIP-seq with Bioconductor in R

Peter Humburg

Statistician, Macquarie University

ChIP-seq with Bioconductor in R

ChIP-seq with Bioconductor in R

ChIP-seq with Bioconductor in R

Annotating peaks

  • Obtain information about gene locations.
  • Assign peaks to genes.
  • Identify genes associated with stronger peaks in one of the conditions.
ChIP-seq with Bioconductor in R
library(TxDb.Hsapiens.UCSC.hg19.knownGene)
genes(TxDb.Hsapiens.UCSC.hg19.knownGene)
  GRanges object with 23056 ranges and 1 metadata column:
          seqnames                 ranges strand |     gene_id
             <Rle>              <IRanges>  <Rle> | <character>
        1    chr19 [ 58858172,  58874214]      - |           1
       10     chr8 [ 18248755,  18258723]      + |          10
      100    chr20 [ 43248163,  43280376]      - |         100
     1000    chr18 [ 25530930,  25757445]      - |        1000
    10000     chr1 [243651535, 244006886]      - |       10000
      ...      ...                    ...    ... .         ...
     9991     chr9 [114979995, 115095944]      - |        9991
     9992    chr21 [ 35736323,  35743440]      + |        9992
     9993    chr22 [ 19023795,  19109967]      - |        9993
     9994     chr6 [ 90539619,  90584155]      + |        9994
     9997    chr22 [ 50961997,  50964905]      - |        9997
    -------
    seqinfo: 93 sequences (1 circular) from hg19 genome
ChIP-seq with Bioconductor in R

Additional Annotations

library(org.Hs.eg.db)
select(org.Hs.eg.db, keys=gene_id, 
       columns="SYMBOL", keytype="ENTREZID")
   ENTREZID  SYMBOL
1         1    A1BG
2        10    NAT2
3       100     ADA
4      1000    CDH2
5     10000    AKT3
6 100008586 GAGE12F
...
ChIP-seq with Bioconductor in R

Annotating Peaks

library(ChIPpeakAnno)

annoPeaks(peaks, human_genes, bindingType="startSite", bindingRegion=c(-5000,5000))
ChIP-seq with Bioconductor in R

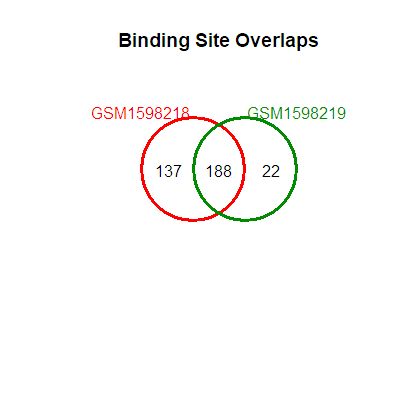
Visualizing similarities and differences

library(DiffBind)
dba.plotVenn(peaks, mask=1:2)
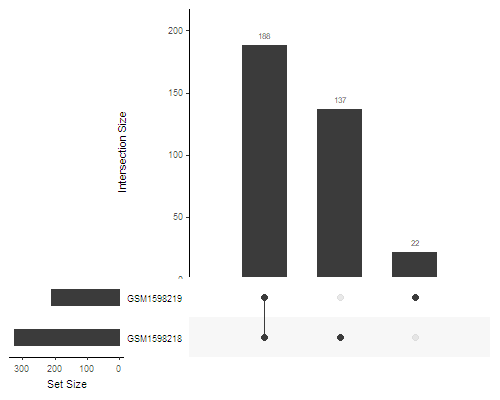
ChIP-seq with Bioconductor in R

Using UpSet plots

library(UpSetR)
called_peaks <- as.data.frame(peaks$called)
upset(called_peaks, sets=colnames(peaks$called), order.by='freq')

ChIP-seq with Bioconductor in R

Let's practice!

ChIP-seq with Bioconductor in R

Preparing Video For Download...