Testing for differential binding
ChIP-seq with Bioconductor in R

Peter Humburg
Statistician, Macquarie University
Comparing groups of ChIP-seq samples
- Use statistical analysis of read counts to identify significant differences between groups.
- DiffBind package provides interface to analysis tools.
- Use either DESeq2 or edgeR.
Creating a shared peak set
Counting reads in peak set:
peak_counts <- dba.count(qc_output, summits=250)
Establishing a contrast
Creating a contrast:
peak_counts <- dba.contrast(peak_counts, categories = DBA_CONDITION)
Other supported categories:
- DBA_ID
- DBA_TISSUE
- DBA_FACTOR
- DBA_TREATMENT
- DBA_REPLICATE
- DBA_CALLER
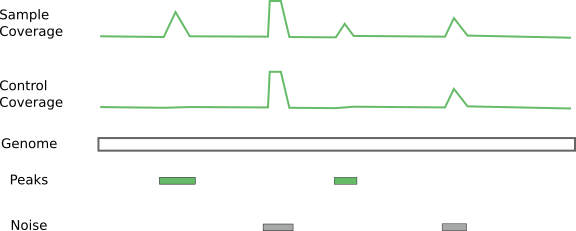
Using controls

Running the analysis
bind_diff <- dba.analyze(peak_counts)
A first look at the results
PCA plot for differentially bound peaks
dba.plotPCA(bind_diff, DBA_Condition, contrast=1)
Heatmap for differentially bound peaks
dba.plotHeatmap(bind_diff, DBA_Condition, contrast=1)
Let's practice!
ChIP-seq with Bioconductor in R

