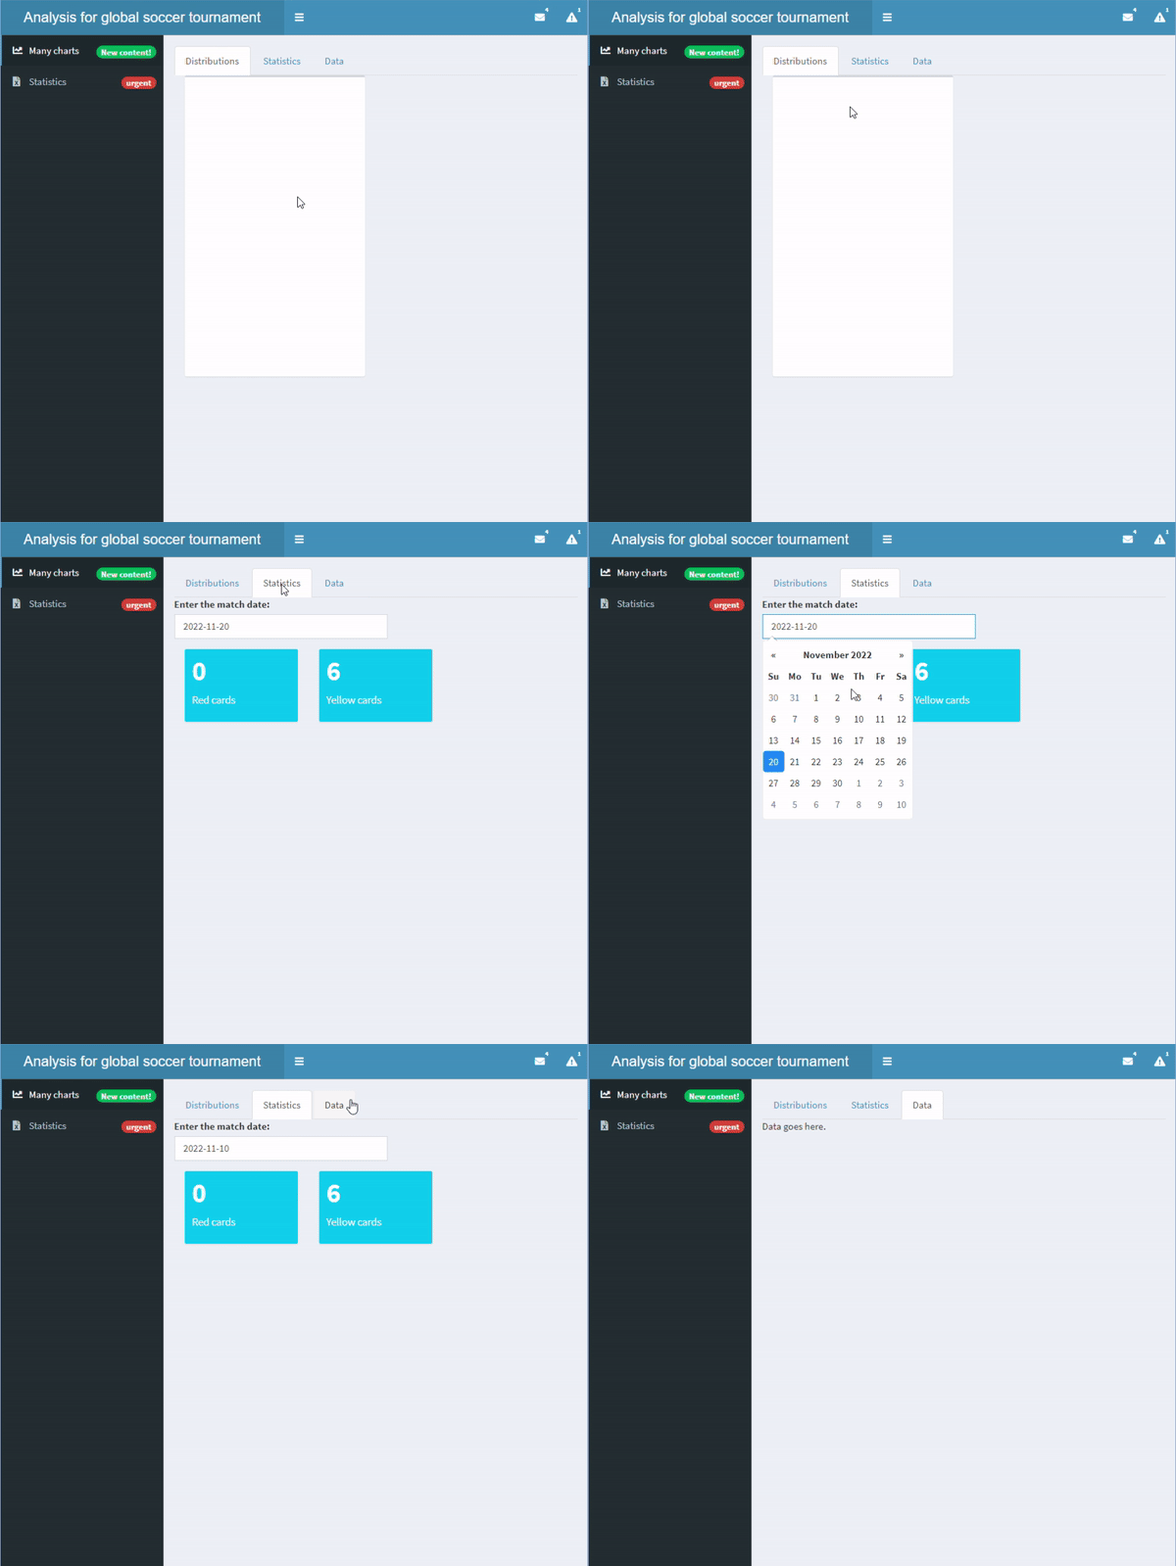
O body

Construindo dashboards com shinydashboard

Png Kee Seng

Researcher

Uma visão geral

  • Parte principal da UI do shinydashboard
  • Normalmente, inputs e outputs ficam aqui
    • É como pratos e pedidos em um restaurante
    • O server faz a ponte na comunicação
  • O body é definido por dashboardBody() e costuma ser salvo como body
body <- dashboardBody(...)
Construindo dashboards com shinydashboard

Wireframe

  • Faça o wireframe
    • Defina a estrutura antes do conteúdo
  • No shinydashboard, primeiro decida as posições dos objetos

O wireframe de um zepelim.

1 Brett Jordan, Flickr
Construindo dashboards com shinydashboard

Adicionando linhas e boxes: boxes vazias

  • Adicione linhas com fluidRow()
  • E adicione boxes com box()

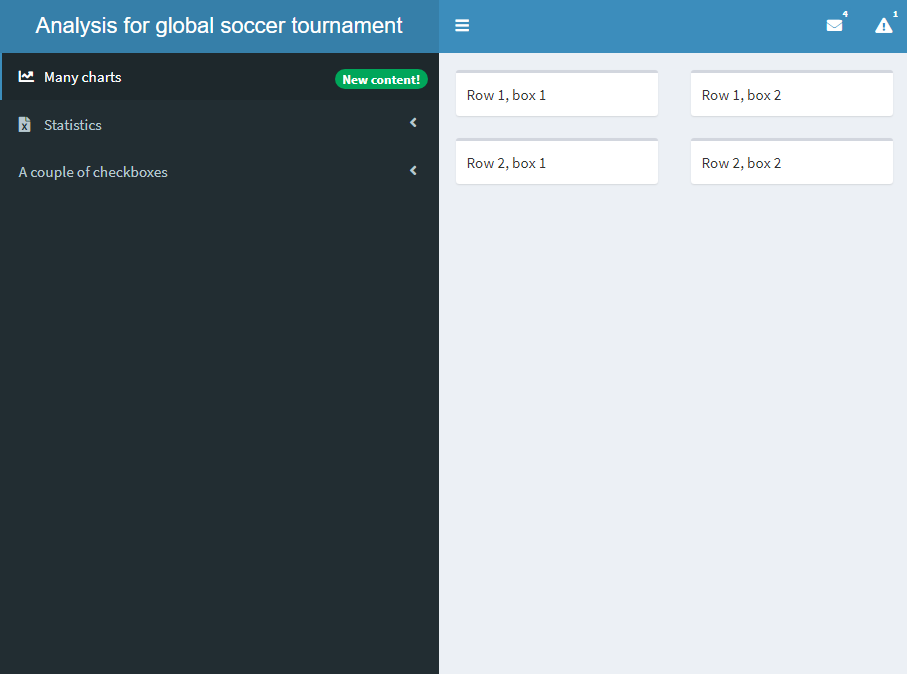
Dashboard com duas linhas, cada uma com duas boxes vazias.

body <- dashboardBody(

fluidRow(
box("Row 1, box 1"), box("Row 1, box 2")
), fluidRow(
box("Row 2, box 1"), box("Row 2, box 2")
)
)
Construindo dashboards com shinydashboard

Adicionando linhas e boxes: conteúdo nas boxes
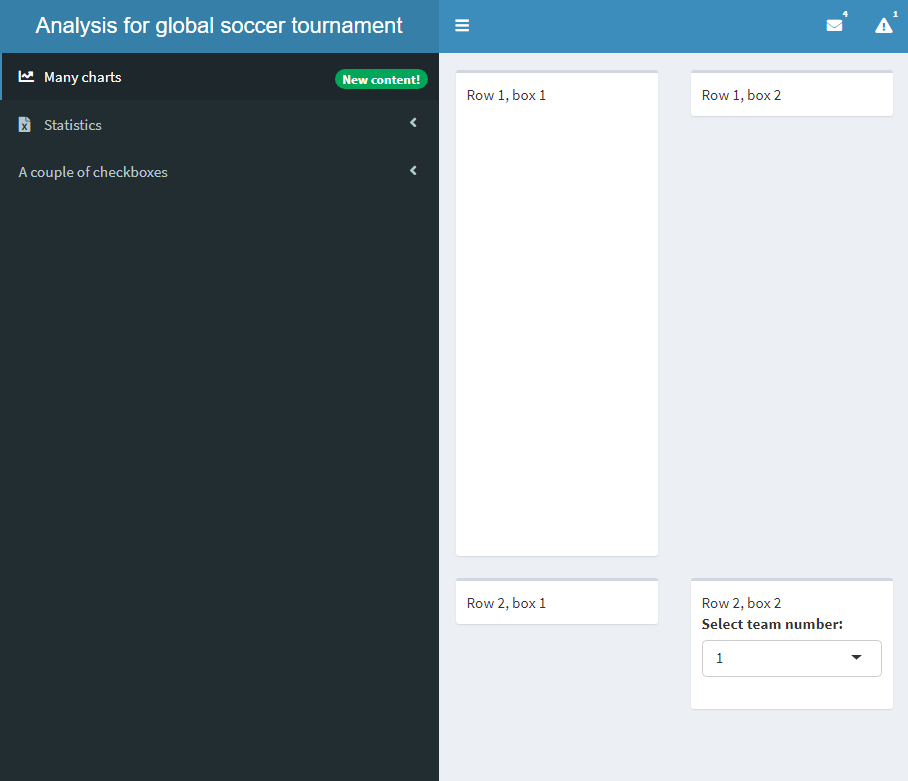
Body com quatro boxes e conteúdo em algumas boxes.

body <- dashboardBody(
  fluidRow(box("Row 1, box 1", 

plotOutput('plot')),
box("Row 1, box 2")), fluidRow(box("Row 2, box 1"), box("Row 2, box 2",
selectInput("select", "Select team number:", choices = c(1,2))))
)
Construindo dashboards com shinydashboard

Evitar overflow nas boxes

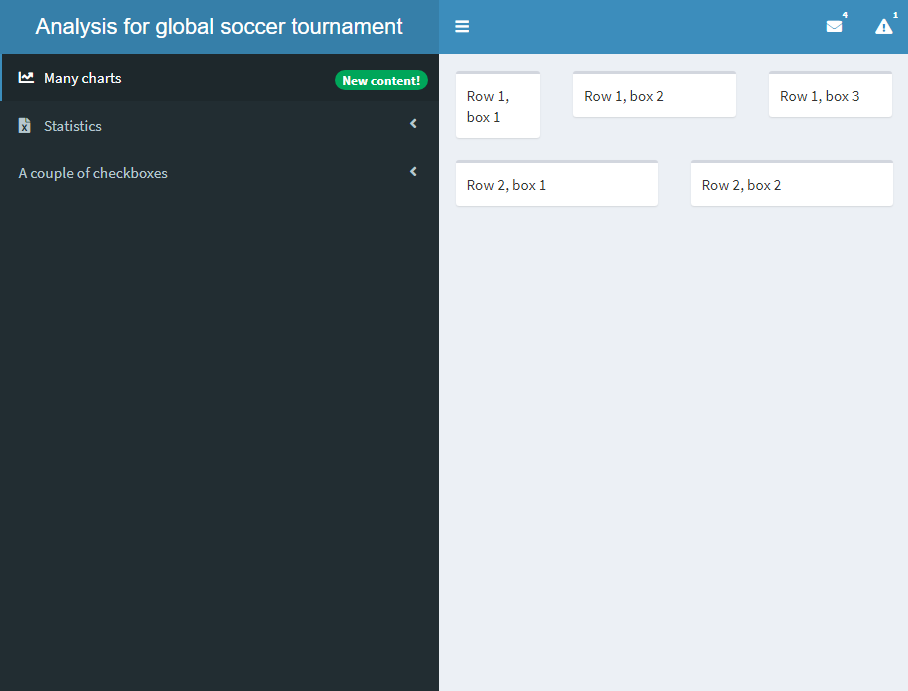
  • Por padrão, cada box ocupa 6 de 12 unidades da largura total
  • Para evitar overflow, defina width
    • No exemplo, use larguras 3, 5 e 4
  • É altamente recomendado usar box()

Mais boxes no body

body <- dashboardBody(
  fluidRow(box("Row 1, box 1"), 
           box("Row 1, box 2"),
           box("Row 1, box 3")),
  fluidRow(box("Row 2, box 1"), 
           box("Row 2, box 2"))
)
body <- dashboardBody(
  fluidRow(box("Row 1, box 1", width = 3), 
           box("Row 1, box 2", width = 5),
           box("Row 1, box 3", width = 4)),
  fluidRow(box("Row 2, box 1"), 
           box("Row 2, box 2"))
)
Construindo dashboards com shinydashboard

valueBox e infoBox

  • Há também boxes para pequenas quantidades de informação
    • valueBox()
    • infoBox()

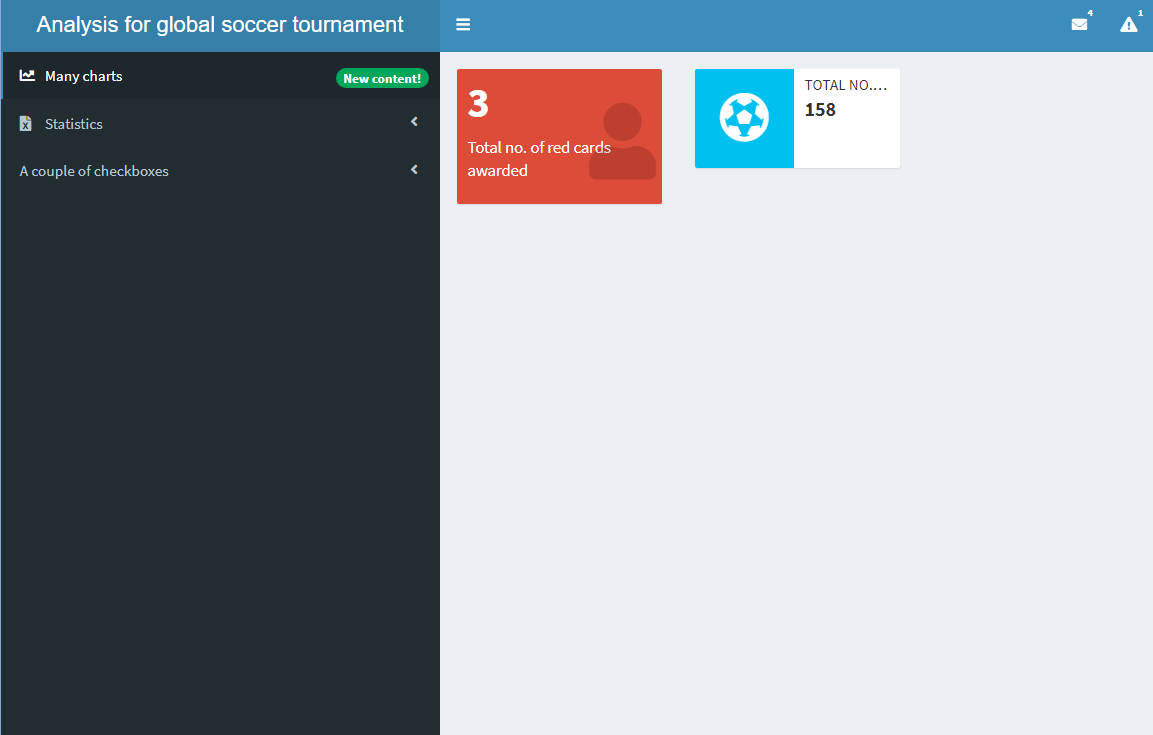
valueBox e infoBox no body.

body <- dashboardBody(
  fluidRow(valueBox(value = 3, 
                    subtitle = "Total de cartões vermelhos aplicados", 
                    icon = icon("user"),
                    color = "red"),

infoBox(value = 158, title = "Total de gols marcados", icon = icon("futbol")) ))
Construindo dashboards com shinydashboard

valueBoxOutput e infoBoxOutput

  • Variações de valueBox() e infoBox(): valueBoxOutput() e infoBoxOutput()
  • São funções de output
  • Há também renderValueBox() e renderInfoBox()
  • valueBox() e infoBox() são necessários

valueBoxOutput e infoBoxOutput no body. Veja que o shinydashboard renderizado é idêntico ao anterior.

body <- dashboardBody(
  fluidRow(valueBoxOutput(outputId = "valuebox1"),
           infoBoxOutput(outputId = "infobox1")
           ))
server <- function(input, output){
  output$valuebox1 <- renderValueBox(
    valueBox(3, "Total de cartões vermelhos aplicados",
                icon = icon("user"), color = "red"))
  output$infobox1 <- renderInfoBox(
    infoBox(158, 
                   title = "Total de gols marcados", 
                   icon = icon("futbol")))
}
Construindo dashboards com shinydashboard

Analogia entre valueBoxOutput e plotOutput

  • plotOutput():
    • Colocado na UI
    • Define sua posição no shinydashboard
  • renderPlot():
    • Colocado no server()
    • Contém um objeto ggplot()
  • valueBoxOutput():
    • Colocado na UI
    • Define sua posição no shinydashboard
  • renderValueBox():
    • Colocado no server()
    • Contém um objeto valueBox()
Construindo dashboards com shinydashboard

Conectando a sidebar e o body

  • Lembra da sidebar com dois botões chamados "charts" e "statistics"
  • Para ligá-los ao body, precisamos adicionar tabItems()
    • Cada página é definida por um tabItem()
    • Os rótulos em cada par menuItem()-tabItem() devem corresponder

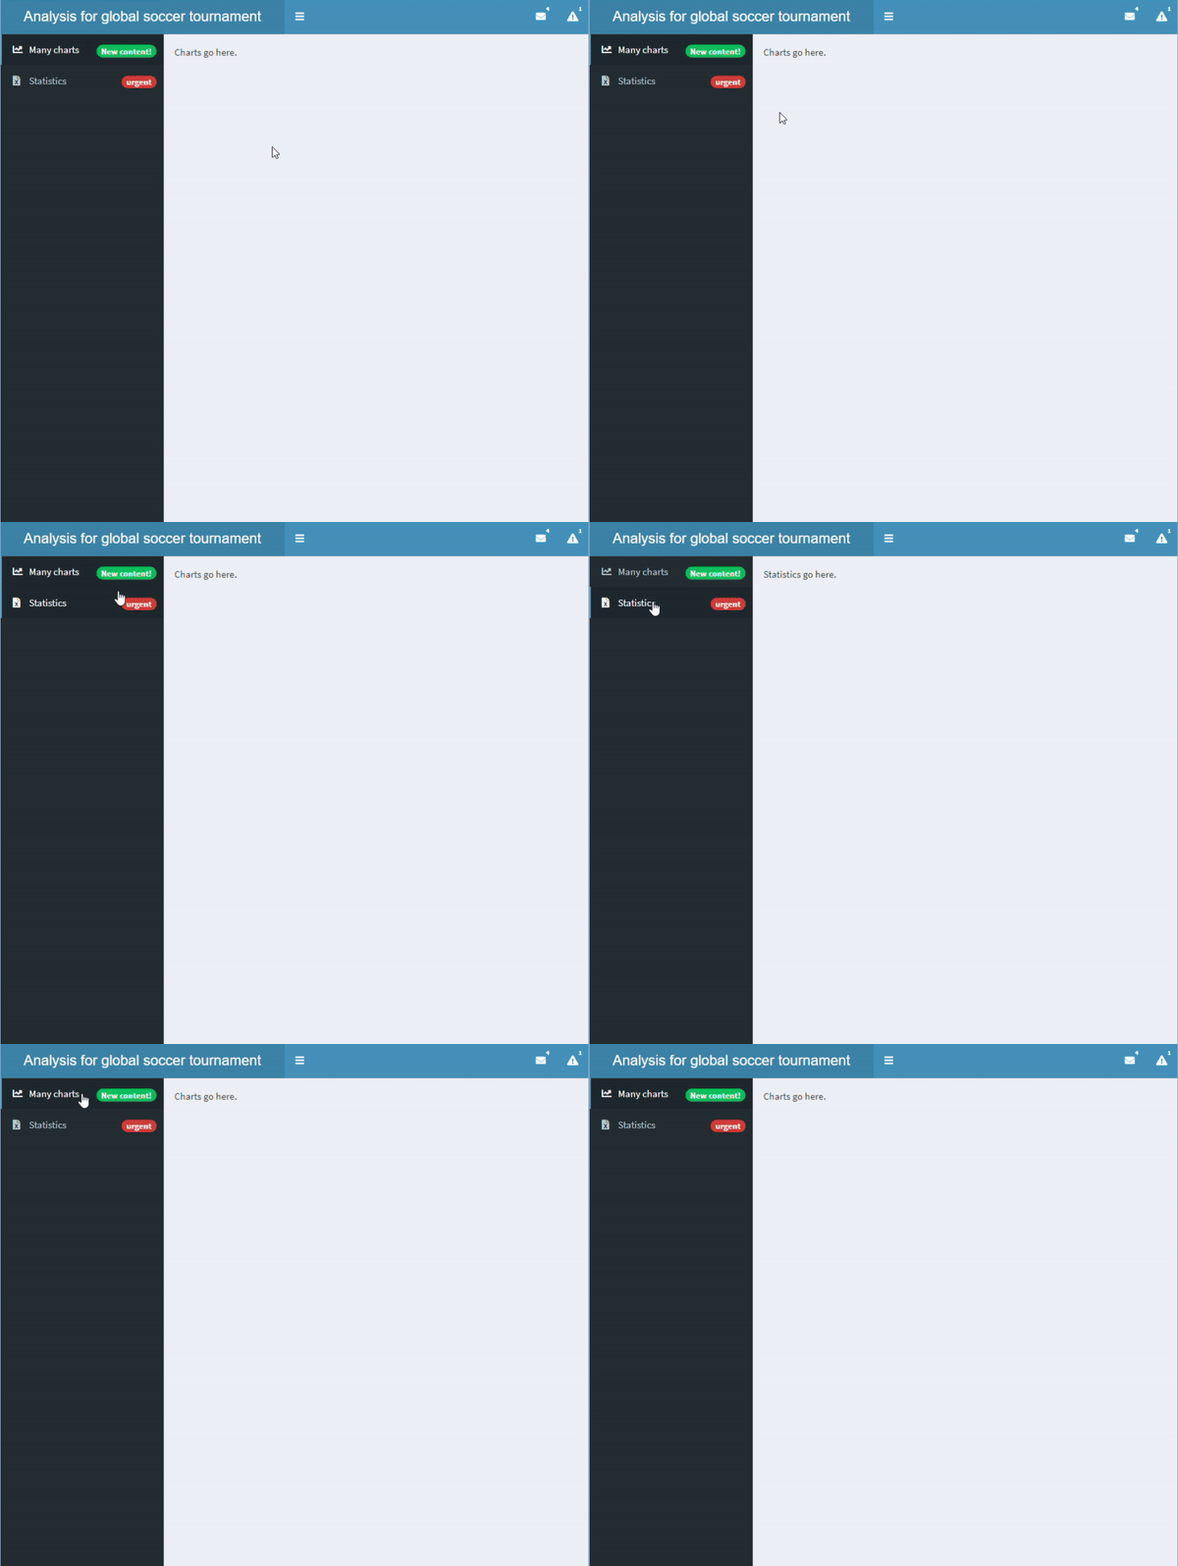
O body e a sidebar agora estão ligados

sidebar <- dashboardSidebar(
  sidebarMenu(
    id = "pages",

menuItem("Many charts", tabName = "charts", icon = icon("chart-line"), badgeLabel = "New content!", badgeColor = "green"),
menuItem("Statistics", icon = icon("file-excel"), tabName = "statistics", badgeLabel = "urgent", badgeColor = "red") ))
body <- dashboardBody( tabItems(
tabItem("charts", "Charts go here." ), tabItem("statistics", "Statistics go here." )))
Construindo dashboards com shinydashboard

Abas no body

  • Em uma shinyApp, um conjunto de abas também pode ser definido com tabsetPanel()
    • Cada aba é definida por tabPanel()
  • Não confunda com tabItems() e tabItem()

Adicionando conjuntos de abas no body

body <- dashboardBody(tabsetPanel(

tabPanel("Distributions", box(plotOutput("dist"))), tabPanel("Statistics", dateInput("matchdate", "Enter the match date:", value = "2022-11-20"), valueBoxOutput("red"), valueBoxOutput("yellow")), tabPanel("Data", "Data goes here.", tableOutput("data"))
))
server <- function(input, output){ output$red <- renderValueBox(valueBox(0, "Red cards")) output$yellow <- renderValueBox(valueBox(6, "Yellow cards")) }
Construindo dashboards com shinydashboard

Vamos praticar!

Construindo dashboards com shinydashboard

Preparing Video For Download...