Tipos de saída

Construindo dashboards com shinydashboard

Png Kee Seng

Researcher

Funções de output e render

  • Em uma shinyApp, haverá saídas
  • Para cada saída, é preciso chamar um par de funções

    • A primeira é uma função na UI
    • Ela define onde a saída será exibida
    • Normalmente tem o formato:
      <type>output(<identifying label>, ...)
      
  • O segundo código fica na função server

    • Ele terá o formato:
      output$<identifying label> <- render<type>(...)
      
Construindo dashboards com shinydashboard

Exemplo: estudo do sono

  • Vamos primeiro importar o conjunto de dados
    library(tidyverse)
    sleep <- read_csv("../data/Time Americans Spend Sleeping.csv")  
    
  • Estas são as colunas
    $ index                   : num [1:945] 0 1 2 3 4  ...
    $ Year                    : num [1:945] 2003 2004 2005 2006 2007 ...
    $ Period                  : chr [1:945] "Annual" "Annual" "Annual" "Annual" ...
    $ Avg hrs per day sleeping: num [1:945] 8.57 8.55 8.62 8.63  ...
    $ Standard Error          : num [1:945] 0.018 0.026 0.023 0.024  ...
    $ Type of Days            : chr [1:945] "All days" "All days" "All days" ...
    $ Age Group               : chr [1:945] "15 years and over" "15 years and over" ...
    $ Activity                : chr [1:945] "Sleeping" "Sleeping" "Sleeping" ...
    $ Sex                     : chr [1:945] "Both" "Both" "Both" ...
    
Construindo dashboards com shinydashboard

textOutput

  • Primeiro, coloque textOutput na UI
ui <- fluidPage(
  titlePanel("Sleeping habits in America"), 
  textOutput("textlabel"))

server <- function(input, output) {
}

shinyApp(ui, server)
Construindo dashboards com shinydashboard

renderText

  • Para renderizar o texto, use renderText no server
  • Vamos usar a notação output$
ui <- fluidPage(
  titlePanel("Sleeping habits in America"), 
  textOutput("textlabel"))

server <- function(input, output) { output$textlabel <- renderText("Sleep deprivation is a serious health issue in many major cities around the world.") }
shinyApp(ui, server)
Construindo dashboards com shinydashboard

textOutput renderizado

demonstração de saída de texto sem interações de entrada.

Construindo dashboards com shinydashboard

textOutput com interações

  • Para permitir interações entre entradas e saídas, chame as entradas com input$
input$<type>
Construindo dashboards com shinydashboard

textOutput com interações

  • Como exemplo, vamos usar um campo de texto.
ui <- fluidPage(
  titlePanel("Sleeping habits in America"), 

textInput("textlabel", "Tell me your name", value = "", placeholder = "Don"),
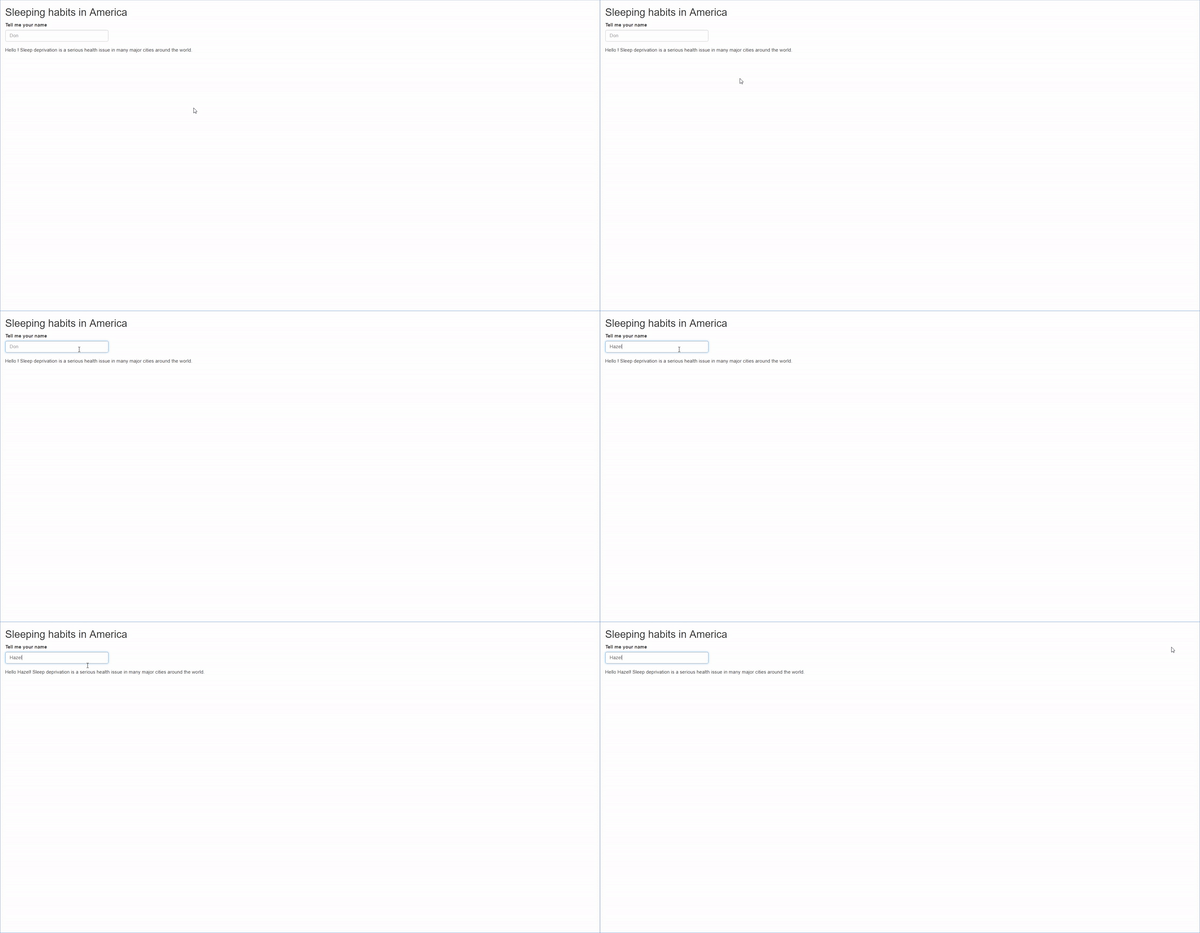
textOutput("textoutlabel")) server <- function(input, output) { output$textoutlabel <- renderText(paste0("Hello ",
input$textlabel,
"Sleep deprivation is a serious health issue in many major cities around the world.")) } shinyApp(ui, server)
Construindo dashboards com shinydashboard

textOutput com interações

saída de texto com interações.

Construindo dashboards com shinydashboard

plotOutput

  • Coloque plotOutput() na UI
ui <- fluidPage(
  titlePanel("Sleeping habits in America"), 

plotOutput("plotlabel"))
server <- function(input, output) { } shinyApp(ui, server)
Construindo dashboards com shinydashboard

renderPlot

  • Precisamos usar renderPlot() em server()
ui <- fluidPage(
  titlePanel("Sleeping habits in America"), 
  plotOutput("plotlabel"))

server <- function(input, output) {

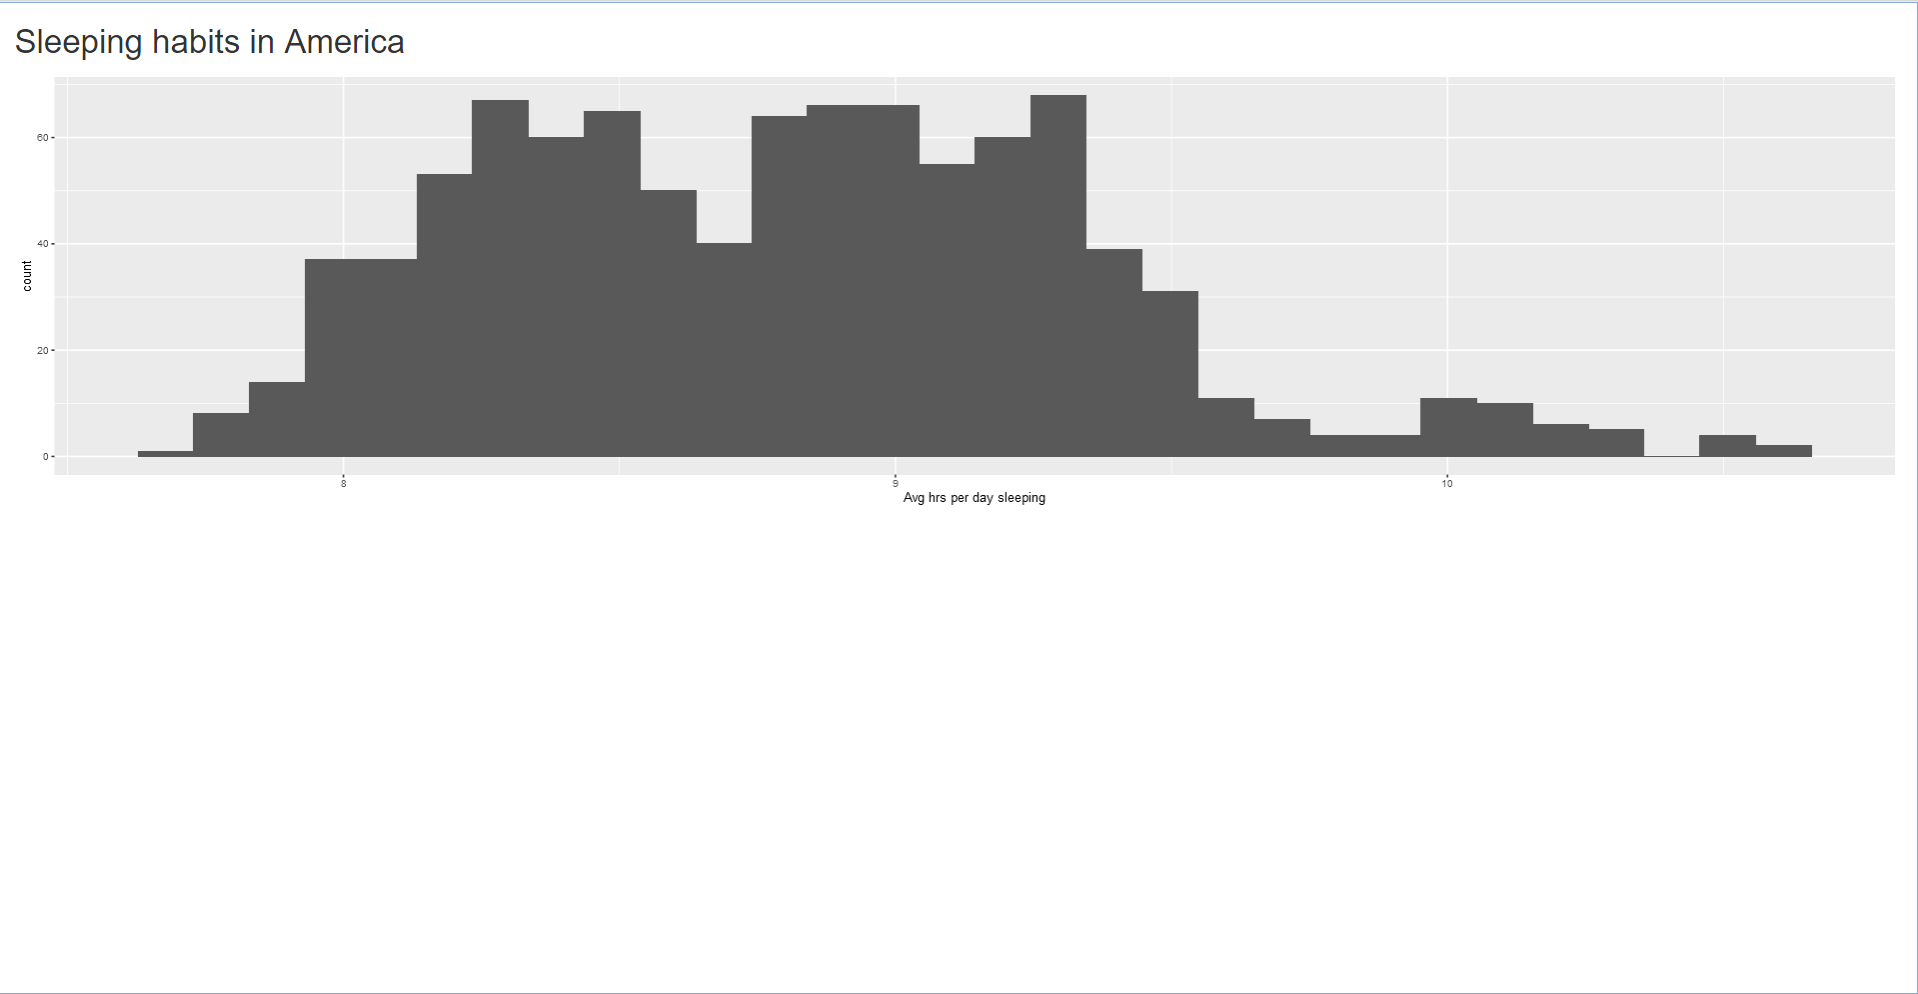
output$plotlabel <- renderPlot({ ggplot(sleep) + geom_histogram(aes(x = `Avg hrs per day sleeping`)) })
} shinyApp(ui, server)
Construindo dashboards com shinydashboard

plotOutput renderizado

demonstração de plotOutput.

Construindo dashboards com shinydashboard

plotOutput com selectInput

  • Entradas do usuário podem gerar resultados diferentes
ui <- fluidPage(
  titlePanel("Sleeping habits in America"), 
  selectInput("selectlabel", 
              "Select an option",
              choices = c("Histogram", "Boxplot")),
  plotOutput("plotlabel"))
Construindo dashboards com shinydashboard

plotOutput com selectInput

server <- function(input, output) {
  output$plotlabel <- renderPlot({
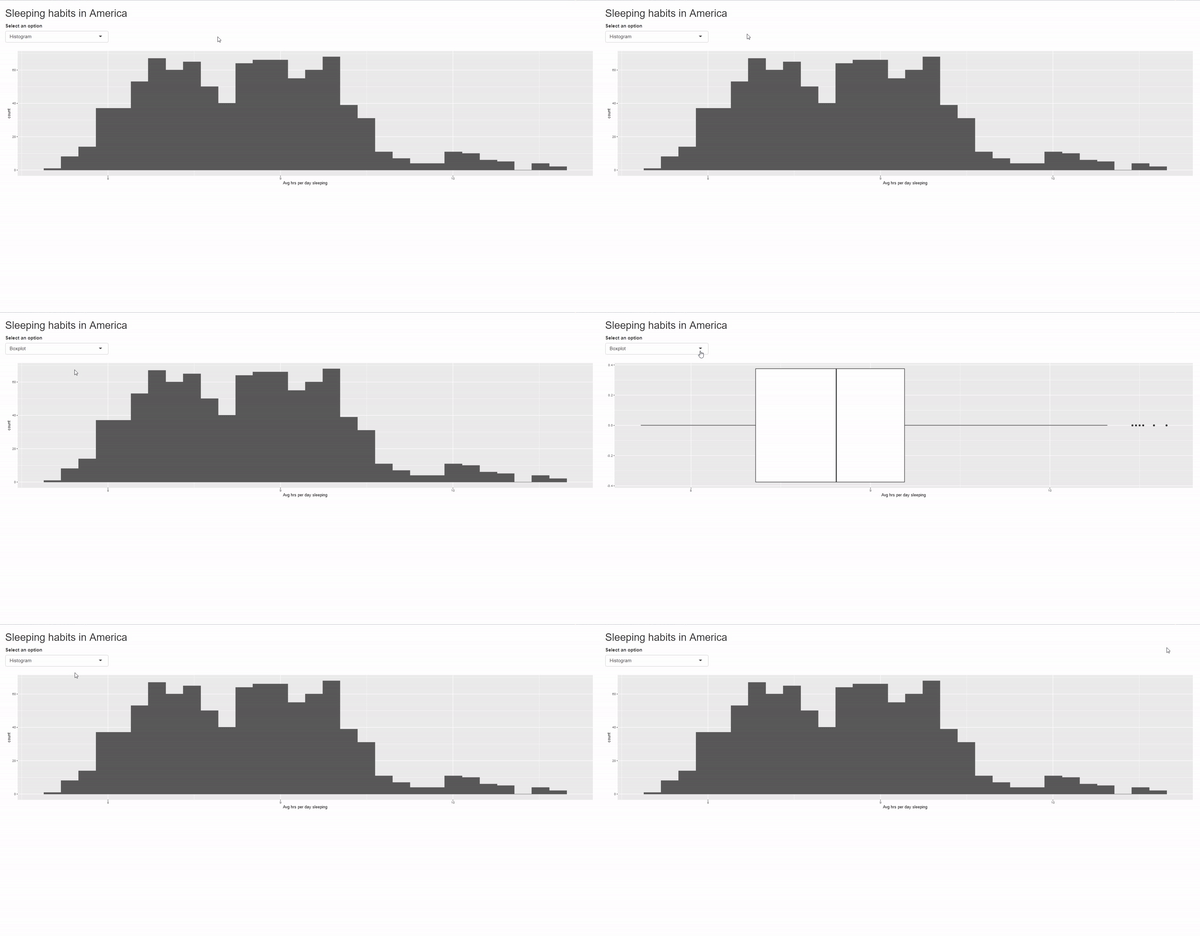
    if (input$selectlabel == "Histogram"){

ggplot(sleep) + geom_histogram(aes(x = `Avg hrs per day sleeping`))
} else if (input$selectlabel == "Boxplot"){
ggplot(sleep) + geom_boxplot(aes(x = `Avg hrs per day sleeping`))
} }) } shinyApp(ui, server)
Construindo dashboards com shinydashboard

plotOutput com selectInput

Demonstração de plotOutput com selectInput

Construindo dashboards com shinydashboard

plotOutput com sliderInput

  • Vamos ver outro exemplo com sliderInput
ui <- fluidPage(
  titlePanel("Sleeping habits in America"), 

sliderInput("sliderlabel", "Average hours of sleep", min = 7.5, max = 11, value = c(7.5, 11), step = 0.02),
plotOutput("plotlabel")) server <- function(input, output) {
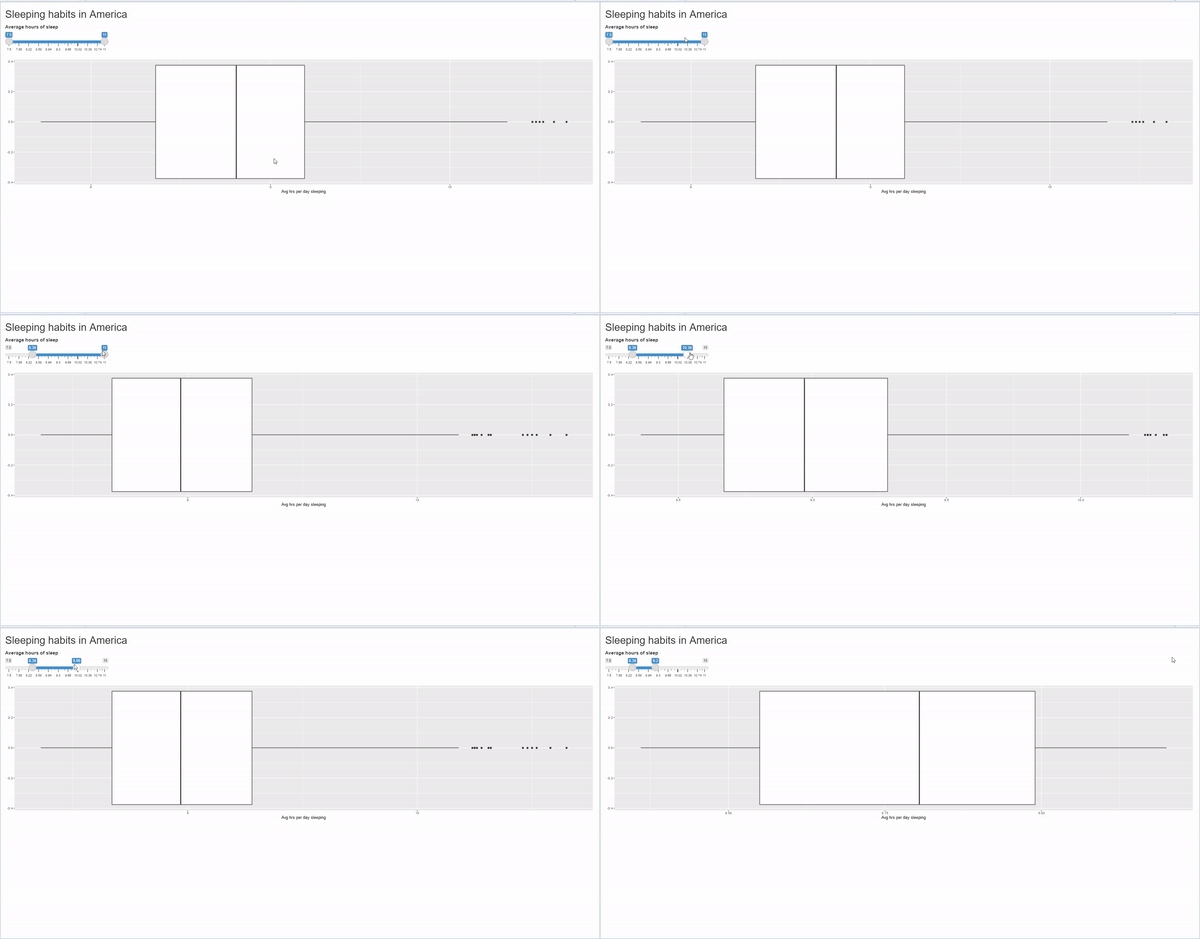
output$plotlabel <- renderPlot({ filter(sleep, `Avg hrs per day sleeping` >= input$sliderlabel[1], `Avg hrs per day sleeping` <= input$sliderlabel[2]) %>% ggplot() + geom_boxplot(aes(x=`Avg hrs per day sleeping`)) })
} shinyApp(ui, server)
Construindo dashboards com shinydashboard

plotOutput com sliderInput

Demonstração de plotOutput com sliderInput

Construindo dashboards com shinydashboard

Ícones no shiny

  • shiny também tem ícones que você pode usar em uma shinyApp
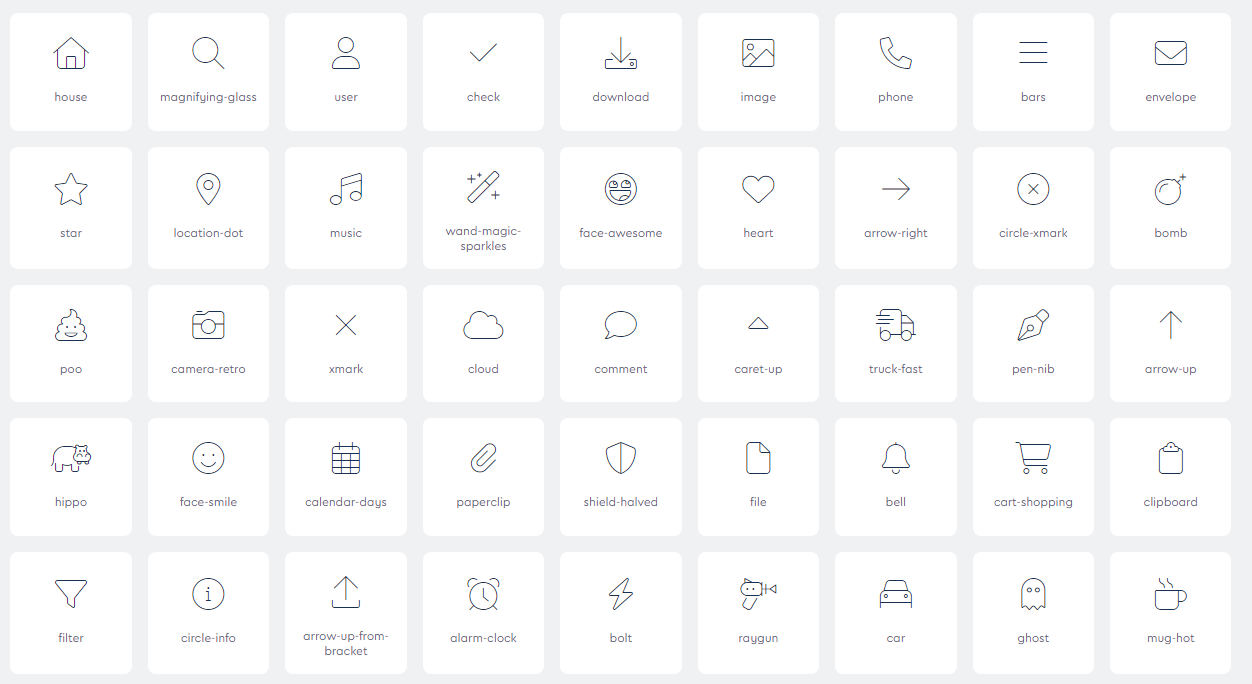
Alguns ícones no shiny

1 https://fontawesome.com/icons
Construindo dashboards com shinydashboard

Ícones no shiny: um exemplo

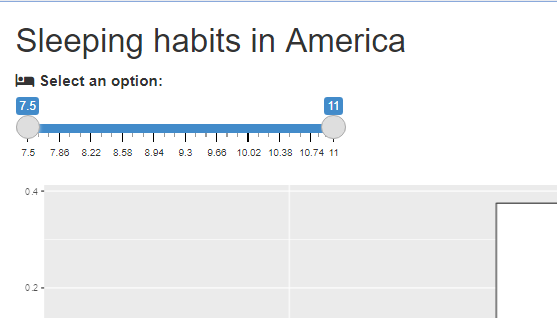
  • Use icon("...")
  • Relembre um exemplo anterior
  • Ex.: icon("bed")
ui <- fluidPage(
  titlePanel("Sleeping habits in America"), 
  sliderInput("sliderlabel",

list(icon("bed"),
"Select an option:"), min = 7.5, max = 11, value = c(7.5, 11), step = 0.02), plotOutput("plotlabel")) server <- function(input, output) { output$plotlabel <- renderPlot({ filter(sleep, `Avg hrs per day sleeping` >= input$sliderlabel[1], `Avg hrs per day sleeping` <= input$sliderlabel[2]) %>% ggplot() + geom_boxplot(aes(x=`Avg hrs per day sleeping`)) }) } shinyApp(ui, server)
Construindo dashboards com shinydashboard

App renderizado com ícone

Demonstração de ícone

Construindo dashboards com shinydashboard

Vamos praticar!

Construindo dashboards com shinydashboard

Preparing Video For Download...