Saiba mais sobre turnover

Análise de RH: Prevendo Rotatividade de Funcionários em R

Anurag Gupta

People Analytics Practitioner

Entendendo os dados

glimpse(org)
Rows: 2,291
Columns: 12
$ emp_id            <chr> "E11061", "E1031", "E6213", "E5900", "E3044"...
$ status            <chr> "Inactive", "Inactive", "Inactive", "Inactiv...
$ turnover          <int> 1, 1, 1, 1, 1, 0, 0, 1, 0, 1, 0, 1, 1, 0, 1,...
$ location          <chr> "New York", "New York", "New York", "New Yor...
$ level             <chr> "Analyst", "Analyst", "Analyst", "Analyst", ...
$ date_of_joining   <chr> "22-03-2012", "09-03-2012", "06-01-2012", "2...
$ last_working_date <chr> "11-09-2014", "05-06-2014", "30-04-2014", "0...
$ gender            <chr> "Male", "Female", "Female", "Female", "Femal...
$ department        <chr> "Customer Operations", "Customer Operations"...
$ mgr_id            <chr> "E1712", "E10524", "E4443", "E3638", "E3312"...
$ cutoff_date       <chr> "31-12-2014", "31-12-2014", "31-12-2014", "3...
$ emp_age           <dbl> 22.49, 22.42, 22.24, 22.32, 22.14, 22.67, 22...
Análise de RH: Prevendo Rotatividade de Funcionários em R

Calculando a taxa de turnover

$$ \text{Taxa de turnover} = \frac{\text{Número de pessoas que saíram}}{\text{Total de pessoas}} $$

ou

$$ \text{Taxa de turnover} = \frac{\text{Contagem de todos os 1's}}{\text{Contagem de todos os 1's + Contagem de todos os 0's}} = {\text{mean(turnover)}} $$

onde

$$ \text{1 = Inactive ; 0 = Active} $$

Análise de RH: Prevendo Rotatividade de Funcionários em R

Contar pessoas ativas e inativas

# Count Active and Inactive employees

org %>% 
  count(status)
# A tibble: 2 x 2
  status      n
  <fct>     <int>
1 Active    1881
2 Inactive   410
Análise de RH: Prevendo Rotatividade de Funcionários em R

Calcular a taxa de turnover

# Calculate average turnover rate 

org %>% 
    summarize(turnover_rate = mean(turnover))
      turnover_rate
1         0.1789612
Análise de RH: Prevendo Rotatividade de Funcionários em R

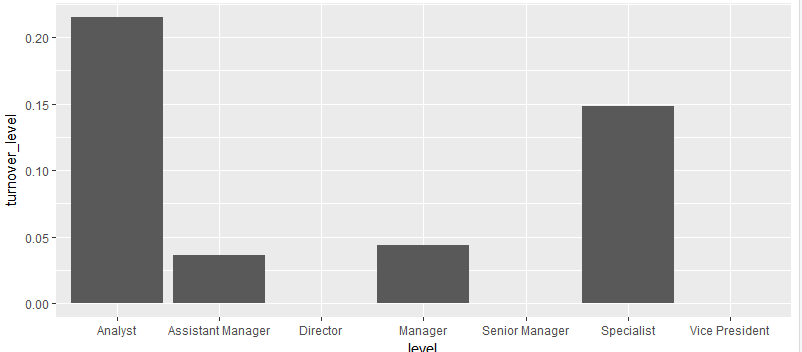
Calcular a taxa por nível

df_level <- org %>%  
    group_by(level) %>% 
    summarize(turnover_level = mean(turnover))

df_level
# A tibble: 7 x 2
  level             turnover_level
  <fct>                      <dbl>
1 Analyst                   0.215 
2 Assistant Manager         0.0365
3 Director                  0     
4 Manager                   0.0435
5 Senior Manager            0     
6 Specialist                0.149 
7 Vice President            0
Análise de RH: Prevendo Rotatividade de Funcionários em R

Visualizar tendências de turnover com ggplot

# Visualize the results
library(ggplot2)
ggplot(df_level, aes(x = level, y = turnover_level)) + 
    geom_col()

Análise de RH: Prevendo Rotatividade de Funcionários em R

Vamos praticar!

Análise de RH: Prevendo Rotatividade de Funcionários em R

Preparing Video For Download...