Graphs in purrr

Foundations of Functional Programming with purrr

Auriel Fournier

Instructor

ggplot() refresher

  • ggplot() requires data frame input
  • Always start with ggplot()
  • Add layers using +
  • geom_*() shows graph type
ggplot(data = dataframe, 
       aes(x = columnA,
       y = columnB))+
  geom_point()

Scatter plot of birds weight vs. their wing length

Foundations of Functional Programming with purrr

Graphing and purrr

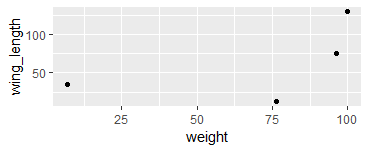
birddf <- bird_measurements %>% 
 map_df(~ data_frame(
            wing_length = .x[["wing length"]],
            weight = .x[["weight"]])) %>%
    ggplot(aes(x = weight,
            y = wing_length))+
    geom_point()

Scatter plot of birds weight vs. their wing length

Foundations of Functional Programming with purrr

Let's purrr-actice!

Foundations of Functional Programming with purrr

Preparing Video For Download...