Filtrar y graficar los datos

Comunicar con datos en el Tidyverse

Timo Grossenbacher

Data Journalist

Filtra los datos para países europeos

ilo_data %>%
  filter(country == "Switzerland")
# A tibble: 27 x 4
       country   year hourly_compensation working_hours
         <fct>  <fct>               <dbl>         <dbl>
 1 Switzerland   1980               10.96      34.70385
 2 Switzerland   1981               10.01      34.33462
 3 Switzerland   1982               10.31      34.12308
 4 Switzerland   1983               10.33      33.84231
 5 Switzerland   1984                9.52      33.47885
 6 Switzerland   1985                9.55      33.35961
 7 Switzerland   1986               13.62      33.19615
 8 Switzerland   1987               16.90      33.17308
 9 Switzerland   1988               17.81      33.16269
10 Switzerland   1989               16.54      32.87308
# ... with 17 more rows
Comunicar con datos en el Tidyverse
ilo_data %>% 
  filter(country %in% c("Sweden", "Switzerland"))
# A tibble: 54 x 4
      country   year hourly_compensation working_hours
        <fct>  <fct>               <dbl>         <dbl>
1      Sweden   1980               12.40      29.16923
2 Switzerland   1980               10.96      34.70385
3      Sweden   1981               11.70      29.00769
4 Switzerland   1981               10.01      34.33462
5      Sweden   1982                9.99      29.27885
# ... with 49 more rows

...equivalente a:

ilo_data %>% 
  filter(country == "Sweden" | country == "Switzerland")
Comunicar con datos en el Tidyverse

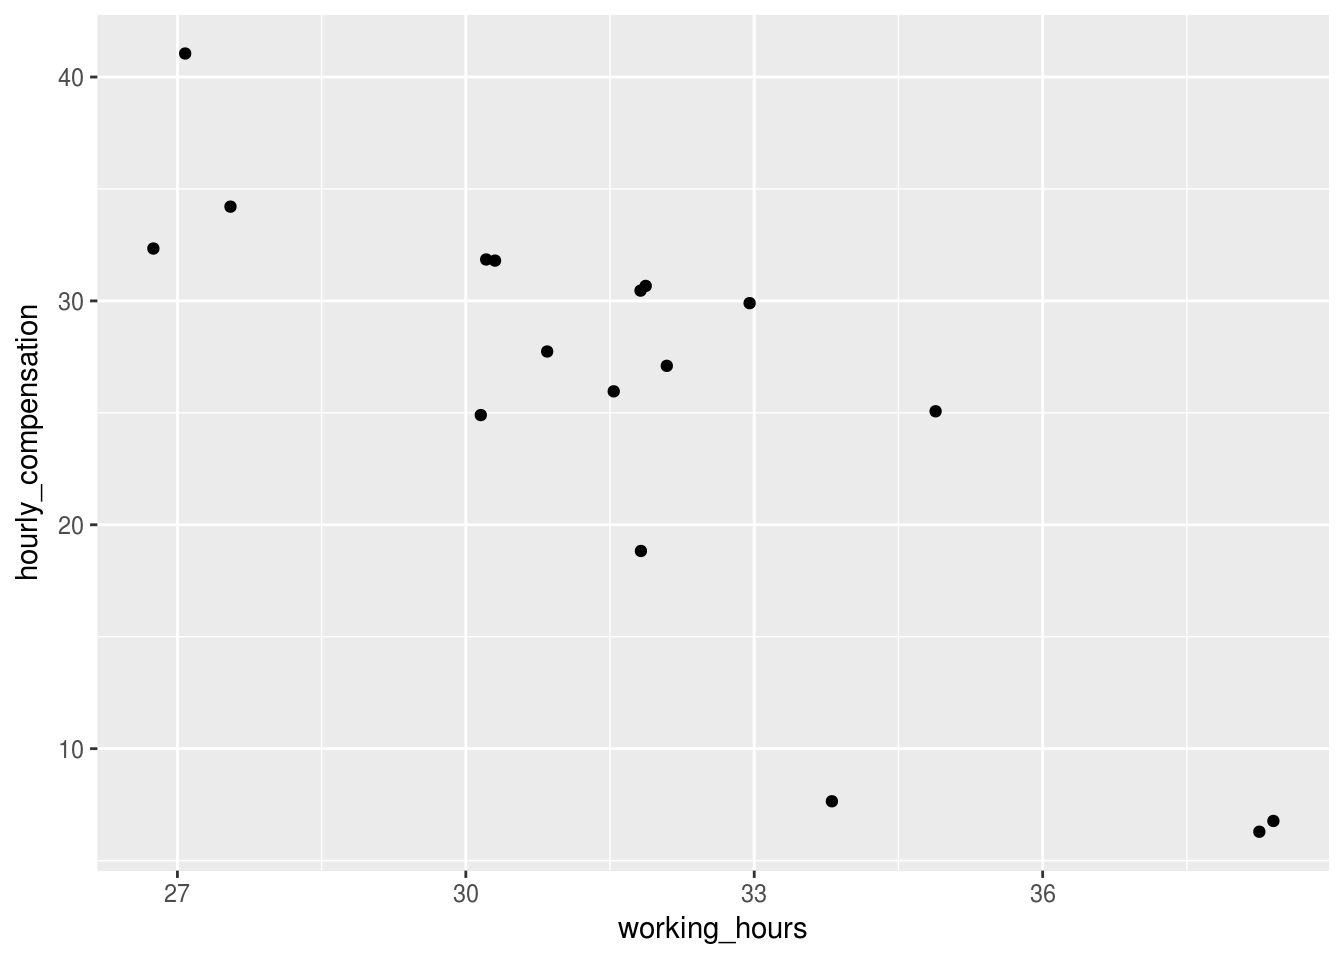
La relación entre ambos indicadores

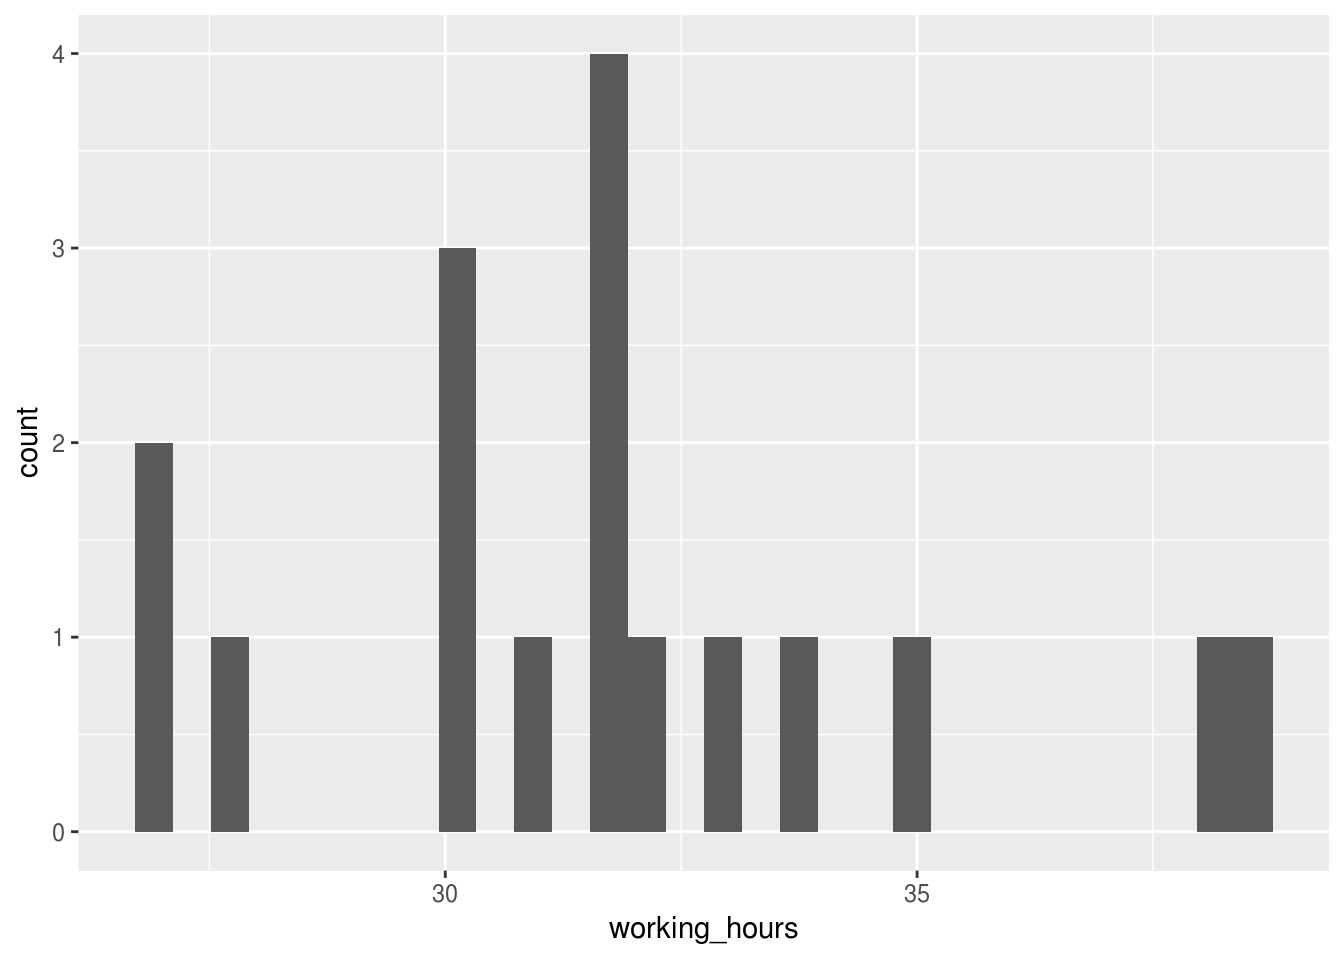
plot_data <- 
  ilo_data %>% 
    filter(year == 2006)

ggplot(plot_data) +
  geom_histogram(
    aes(x = working_hours))
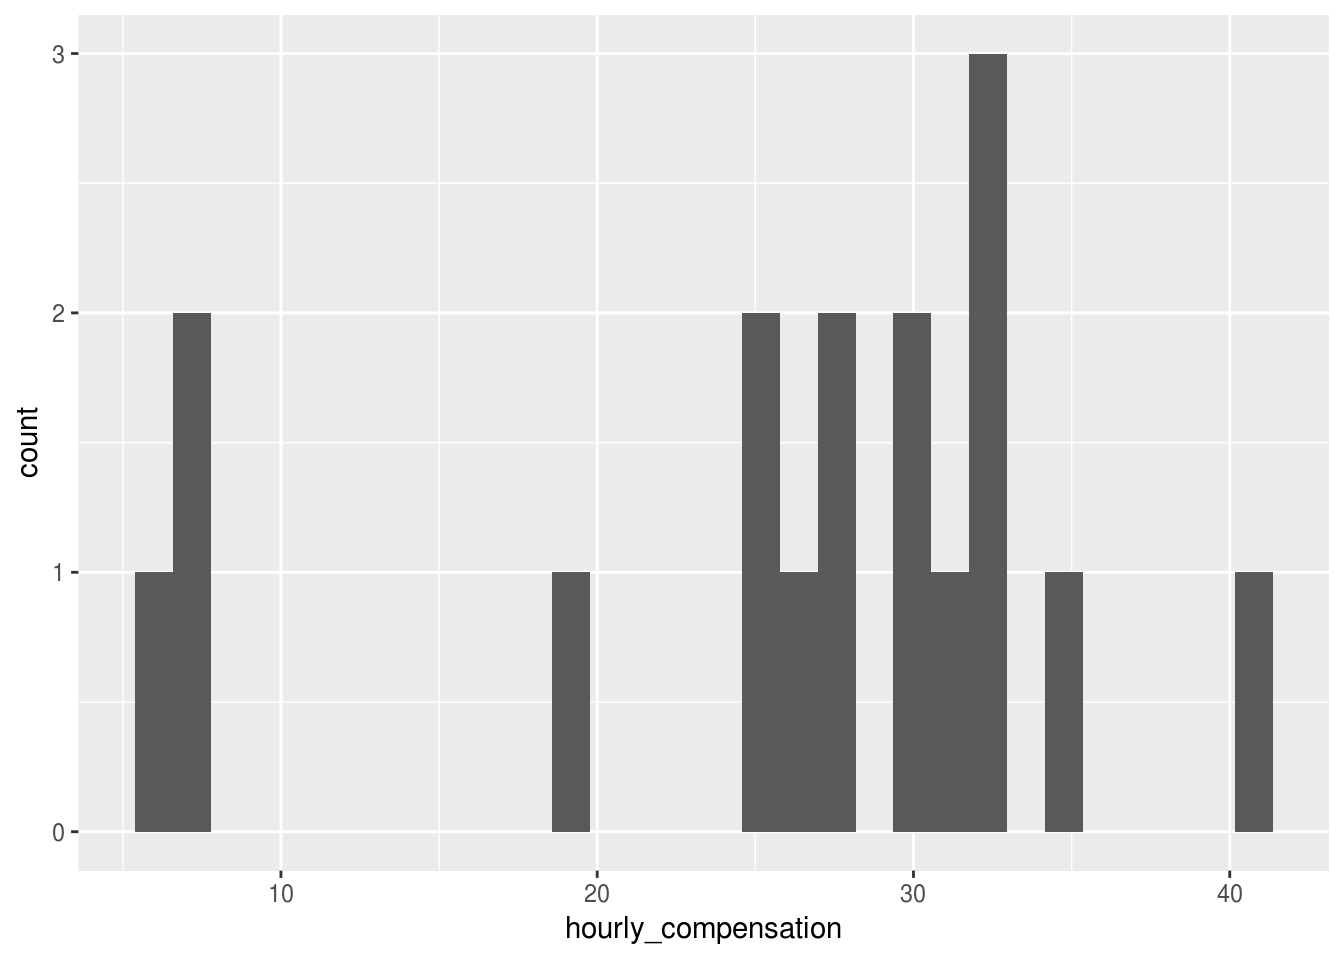
plot_data <- 
  ilo_data %>% 
    filter(year == 2006)

ggplot(plot_data) +
  geom_histogram(
    aes(x = hourly_compensation))
Comunicar con datos en el Tidyverse

La relación entre ambos indicadores

Comunicar con datos en el Tidyverse

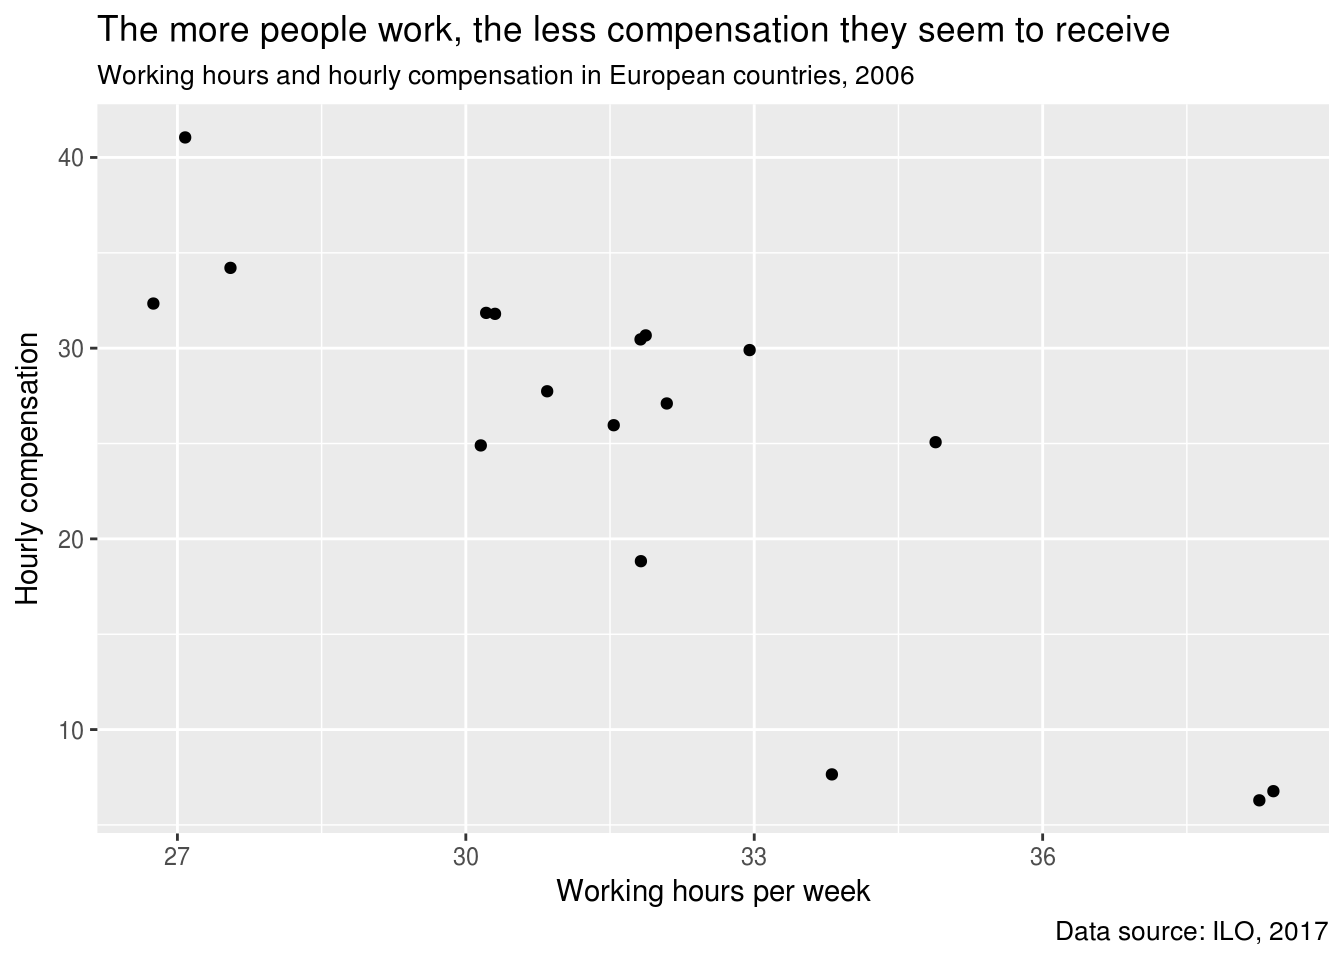
Añadir etiquetas al gráfico

Comunicar con datos en el Tidyverse

Un poco de repetición de funciones de dplyr

ilo_data %>%
  group_by(country) %>% 
  summarize(median_working_hours = median(working_hours))
# A tibble: 17 x 2
     country median_working_hours
       <fct>                <dbl>
1    Austria             31.69904
2    Belgium             32.03846
3 Czech Rep.             39.10000
4    Finland             34.04808
5     France             32.34615
# ... with 12 more rows
Comunicar con datos en el Tidyverse

¡Vamos a practicar!

Comunicar con datos en el Tidyverse

Preparing Video For Download...