Moyennes mobiles indicatrices de tendance

Négociation financière en Python

Chelsea Yang

Data Science Instructor

Qu'est-ce qu'un indicateur technique ?

  • Calculs mathématiques à partir de données historiques du marché
  • Supposent un marché efficient où le prix intègre toute l'information publique
  • Aident à comprendre les schémas de prix passés
Négociation financière en Python

Types d'indicateurs

  • Indicateurs de tendance : mesurent la direction ou la force d'une tendance
    • Exemple : moyennes mobiles (MA), indice directionnel moyen (ADX)
  • Indicateurs de momentum : mesurent la vitesse du mouvement des prix
    • Exemple : indice de force relative (RSI)
  • Indicateurs de volatilité : mesurent l'ampleur des écarts de prix
    • Exemple : bandes de Bollinger
Négociation financière en Python

Le paquet TA-Lib

TA-Lib : Technical Analysis Library

  • Comprend plus de 150 indicateurs techniques implémentés
import talib
Négociation financière en Python

Indicateurs de moyenne mobile

  • SMA : Simple Moving Average (moyenne mobile simple)
  • EMA : Exponential Moving Average (moyenne mobile exponentielle)


  • Caractéristiques :
    • Évoluent avec le prix
    • Lissent les données pour mieux indiquer la direction du prix
Négociation financière en Python

Moyenne mobile simple (SMA)

$ SMA = (P_1+P_2+...+P_n)/n $

# Calculate two SMAs
stock_data['SMA_short'] = talib.SMA(stock_data['Close'], timeperiod=10)
stock_data['SMA_long'] = talib.SMA(stock_data['Close'], timeperiod=50)

# Print the last five rows print(stock_data.tail())
             Close  SMA_short  SMA_long
Date                                   
2020-11-24 1768.88    1758.77   1594.74
2020-11-25 1771.43    1760.65   1599.75
2020-11-27 1793.19    1764.98   1605.70
2020-11-30 1760.74    1763.35   1611.71
2020-12-01 1798.10    1765.02   1619.05

Négociation financière en Python

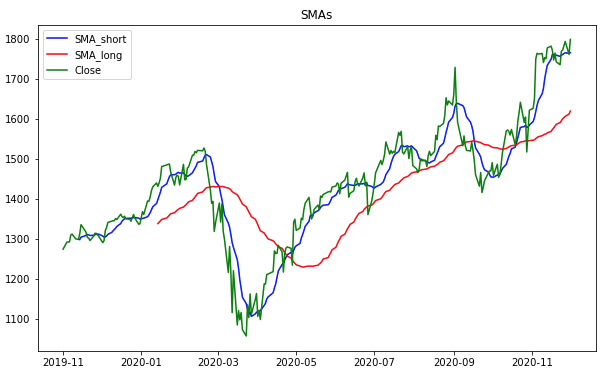
Tracer la SMA

import matplotlib.pyplot as plt

# Plot SMA with the price
plt.plot(stock_data['SMA_short'], 
         label='SMA_short')
plt.plot(stock_data['SMA_long'], 
         label='SMA_long')
plt.plot(stock_data['Close'], 
         label='Close')

# Customize and show the plot
plt.legend()
plt.title('SMAs')
plt.show()

Graphique des SMA

Négociation financière en Python

Moyenne mobile exponentielle (EMA)

$EMA_n = P_n \times multiplier + \text{previous EMA} \times (1-multiplier)$

$multiplier = 2 / (n + 1)$

# Calculate two EMAs
stock_data['EMA_short'] = talib.EMA(stock_data['Close'], timeperiod=10)
stock_data['EMA_long'] = talib.EMA(stock_data['Close'], timeperiod=50)
# Print the last five rows
print(stock_data.tail())
             Close  EMA_short  EMA_long
Date                                   
2020-11-24 1768.88    1748.65   1640.98
2020-11-25 1771.43    1752.79   1646.09
2020-11-27 1793.19    1760.13   1651.86
2020-11-30 1760.74    1760.24   1656.13
2020-12-01 1798.10    1767.13   1661.70
Négociation financière en Python

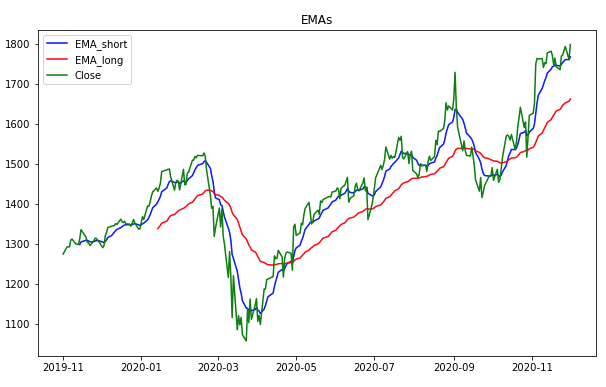
Tracer l'EMA

import matplotlib.pyplot as plt
# Plot EMA with the price
plt.plot(stock_data['EMA_short'], 
         label='EMA_short')
plt.plot(stock_data['EMA_long'], 
         label='EMA_long')
plt.plot(stock_data['Close'], 
         label='Close')

# Customize and show the plot
plt.legend()
plt.title('EMAs')
plt.show()

Graphique des EMA

Négociation financière en Python

SMA vs EMA

L'EMA est plus sensible au mouvement de prix le plus récent
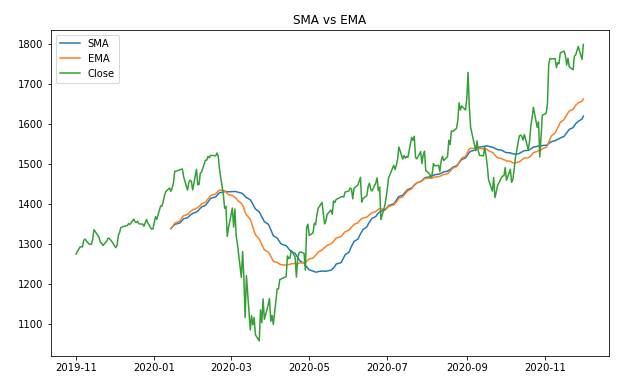
Graphique comparant SMA et EMA avec la même fenêtre de calcul

Négociation financière en Python

Passons à la pratique !

Négociation financière en Python

Preparing Video For Download...