Négociation financière en Python
Chelsea Yang
Data Science Instructor
Le trading financier consiste à acheter et vendre des actifs financiers
Divers instruments à négocier :
Générer un profit en prenant des risques calculés
Participants au marché :
Données de séries chronologiques : séquence de points de données indexés dans le temps
import pandas as pd
# Load the data
bitcoin_data = pd.read_csv("bitcoin_data.csv", index_col='Date', parse_dates=True)
print(bitcoin_data.head())
Open High Low Close Volume
Date
2019-01-01 3746.71 3850.91 3707.23 3843.52 4324200990
2019-01-02 3849.22 3947.98 3817.41 3943.41 5244856835
2019-01-03 3931.05 3935.69 3826.22 3836.74 4530215218
2019-01-04 3832.04 3865.93 3783.85 3857.72 4847965467
2019-01-05 3851.97 3904.90 3836.90 3845.19 5137609823
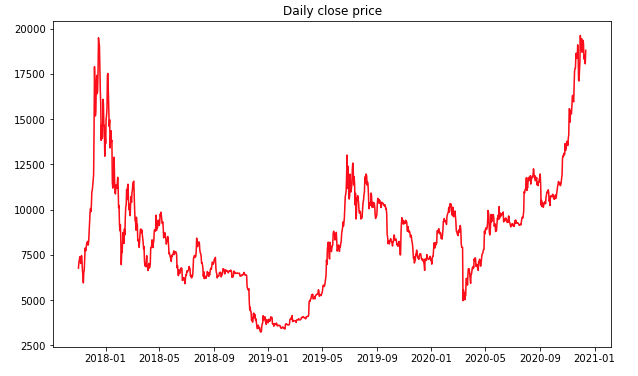
import matplotlib.pyplot as plt
plt.plot(bitcoin_data['Close'], color='red')
plt.title("Daily close price")
plt.show()

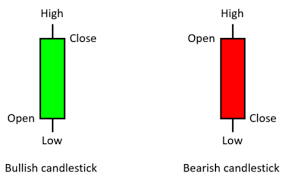
Chaque chandelier affiche le plus haut, le plus bas, l'ouverture et la clôture
La couleur indique un mouvement haussier (prix en hausse) ou baissier (prix en baisse)
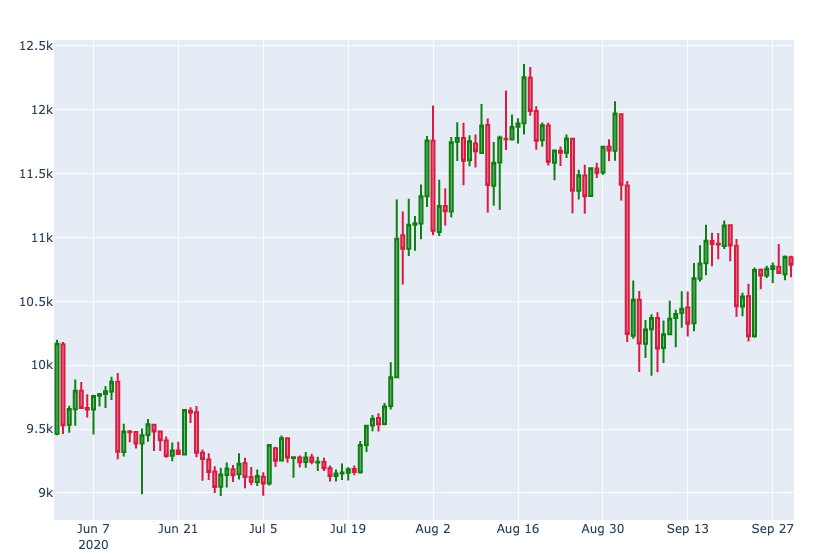
import plotly.graph_objects as go# Define the candlestick candlestick = go.Candlestick( x = bitcoin_data.index, open = bitcoin_data['Open'], high = bitcoin_data['High'], low = bitcoin_data['Low'], close = bitcoin_data['Close'])# Create a plot fig = go.Figure(data=[candlestick])# Show the plot fig.show()

Négociation financière en Python