Introduction à la visualisation de données avec Plotly en Python
Alex Scriven
Data Scientist
$$

$$
add_annotation()$$
update_layout() et l'argument annotationstext - Le texte à afficher$$
x et y : emplacement de l'annotation$$
showarrow = True/False : inclure une flèche$$
🛑 Attention aux positions absolues : si les données changent, des éléments peuvent se chevaucher
x et y correspondent aux valeurs du graphique$$
xref et yref à paper pour positionner absolumentx et y deviennent des pourcentages de 0 à 1 sur la zone du graphiquex=0.5, y=0.5) place au centre du graphique
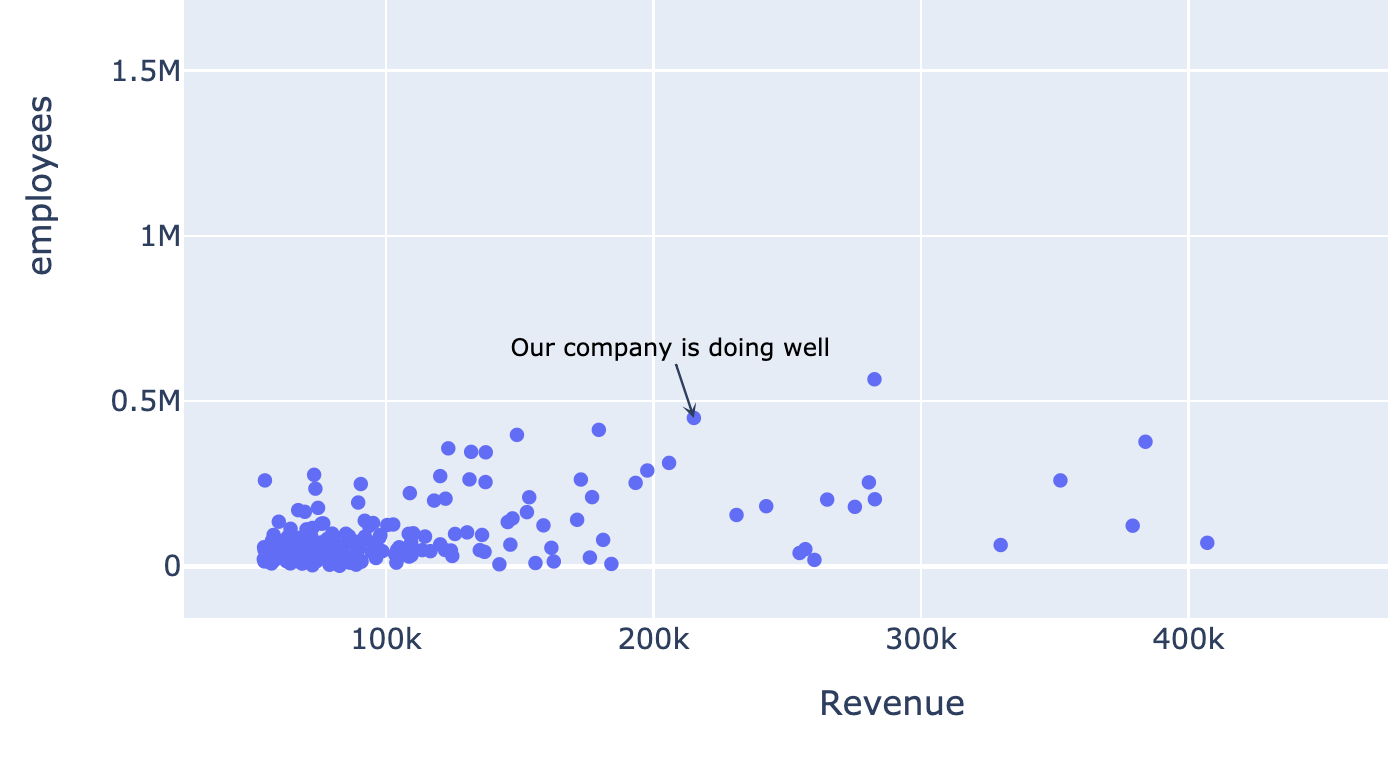
my_annotation = dict( x=215111, y=449000,showarrow=True, arrowhead=3,text="Our company is doing well", font=dict(size=10, color="black") )fig.update_layout(annotations=[my_annotation]) fig.show()
$$

$$
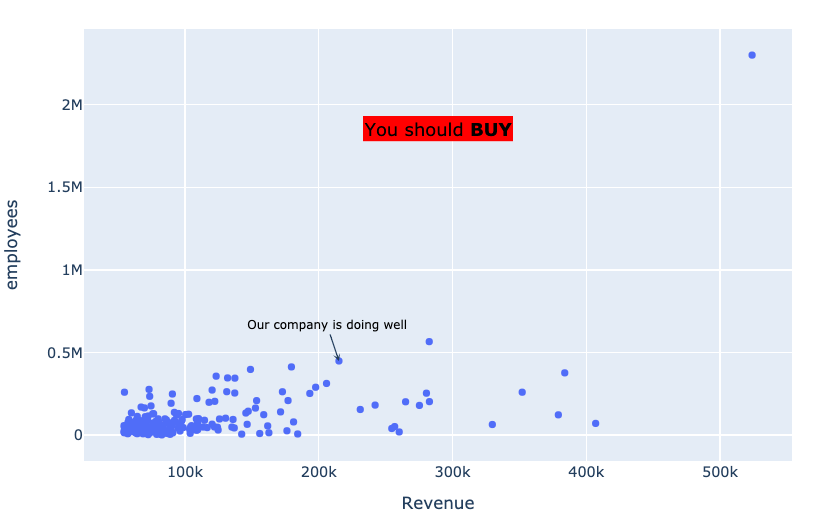
float_annotation = dict( xref="paper", yref="paper",x=0.5, y=0.8,showarrow=False, text="You should <b>BUY</b>", font=dict(size=15, color="black"), bgcolor="rgb(255,0,0)" )

Introduction à la visualisation de données avec Plotly en Python