Manipuler des séries chronologiques en Python
Stefan Jansen
Founder & Lead Data Scientist at Applied Artificial Intelligence
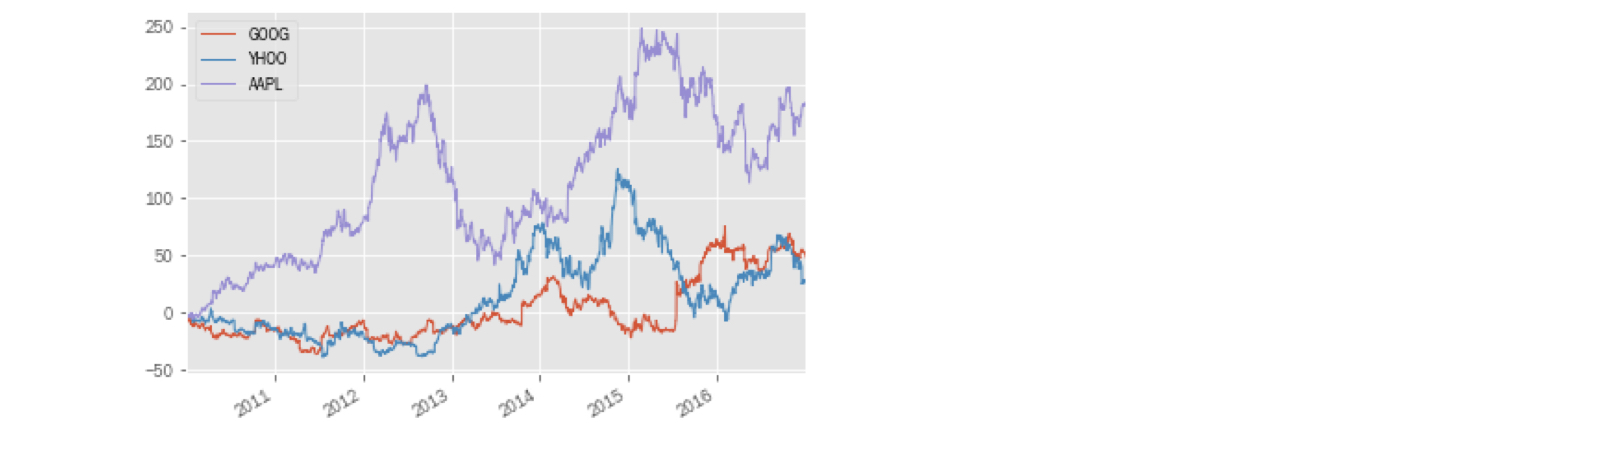
Séries de prix boursiers : difficile à comparer à des niveaux différents
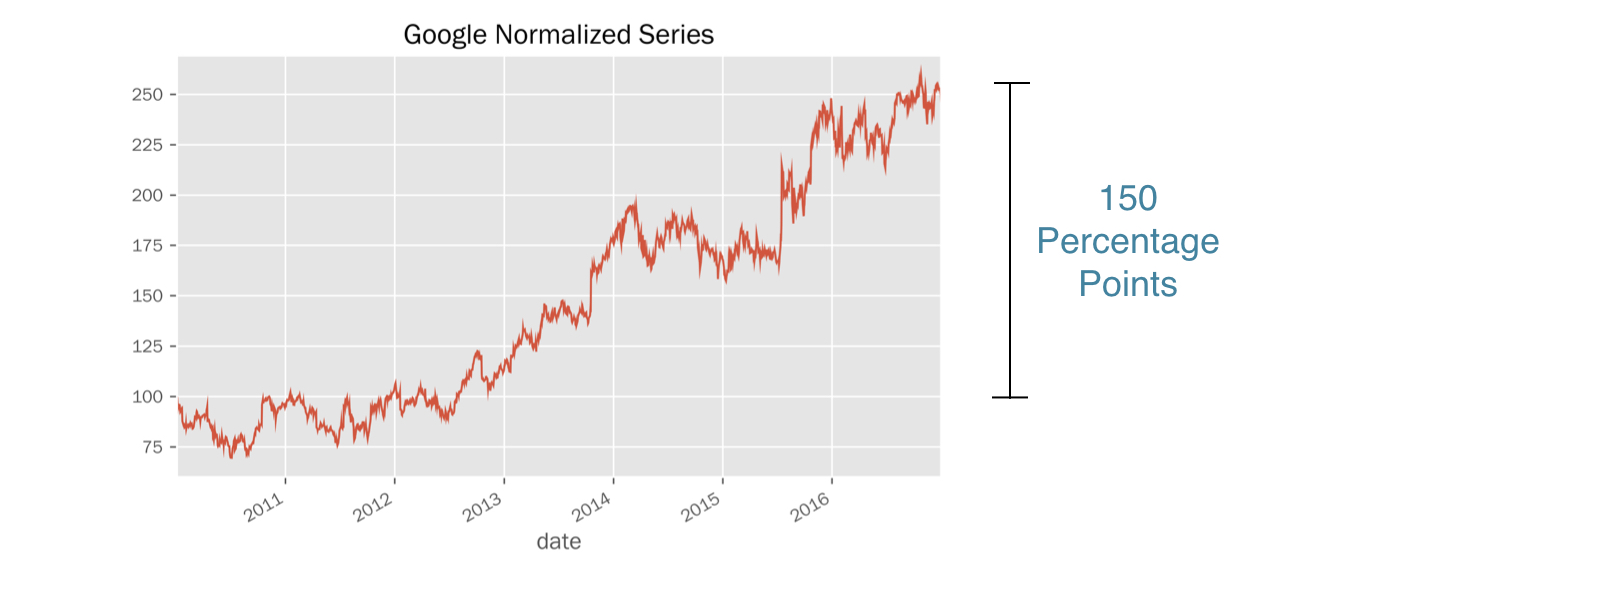
Solution simple : normaliser les séries pour commencer à 100
Diviser tous les prix par le premier, puis multiplier par 100
Même point de départ
Tous les prix relatifs au point de départ
Écart au point de départ en points de pourcentage
google = pd.read_csv('google.csv', parse_dates=['date'], index_col='date')google.head(3)
price
date
2010-01-04 313.06
2010-01-05 311.68
2010-01-06 303.83
first_price = google.price.iloc[0] # int-based selectionfirst_price
313.06
first_price == google.loc['2010-01-04', 'price']
True
normalized = google.price.div(first_price).mul(100)normalized.plot(title='Google Normalized Series')
prices = pd.read_csv('stock_prices.csv', parse_dates=['date'], index_col='date')prices.info()
DatetimeIndex: 1761 entries, 2010-01-04 to 2016-12-30
Data columns (total 3 columns):
AAPL 1761 non-null float64
GOOG 1761 non-null float64
YHOO 1761 non-null float64
dtypes: float64(3)
prices.head(2)
AAPL GOOG YHOO
Date
2010-01-04 30.57 313.06 17.10
2010-01-05 30.63 311.68 17.23
prices.iloc[0]
AAPL 30.57
GOOG 313.06
YHOO 17.10
Name: 2010-01-04 00:00:00, dtype: float64
normalized = prices.div(prices.iloc[0])normalized.head(3)
AAPL GOOG YHOO
Date
2010-01-04 1.000000 1.000000 1.000000
2010-01-05 1.001963 0.995592 1.007602
2010-01-06 0.985934 0.970517 1.004094
.div() : alignement automatique de l'index de Series et des colonnes de DataFrameindex = pd.read_csv('benchmark.csv', parse_dates=['date'], index_col='date')index.info()
DatetimeIndex: 1826 entries, 2010-01-01 to 2016-12-30
Data columns (total 1 columns):
SP500 1762 non-null float64
dtypes: float64(1)
prices = pd.concat([prices, index], axis=1).dropna()prices.info()
DatetimeIndex: 1761 entries, 2010-01-04 to 2016-12-30
Data columns (total 4 columns):
AAPL 1761 non-null float64
GOOG 1761 non-null float64
YHOO 1761 non-null float64
SP500 1761 non-null float64
dtypes: float64(4)
prices.head(1)
AAPL GOOG YHOO SP500
2010-01-04 30.57 313.06 17.10 1132.99
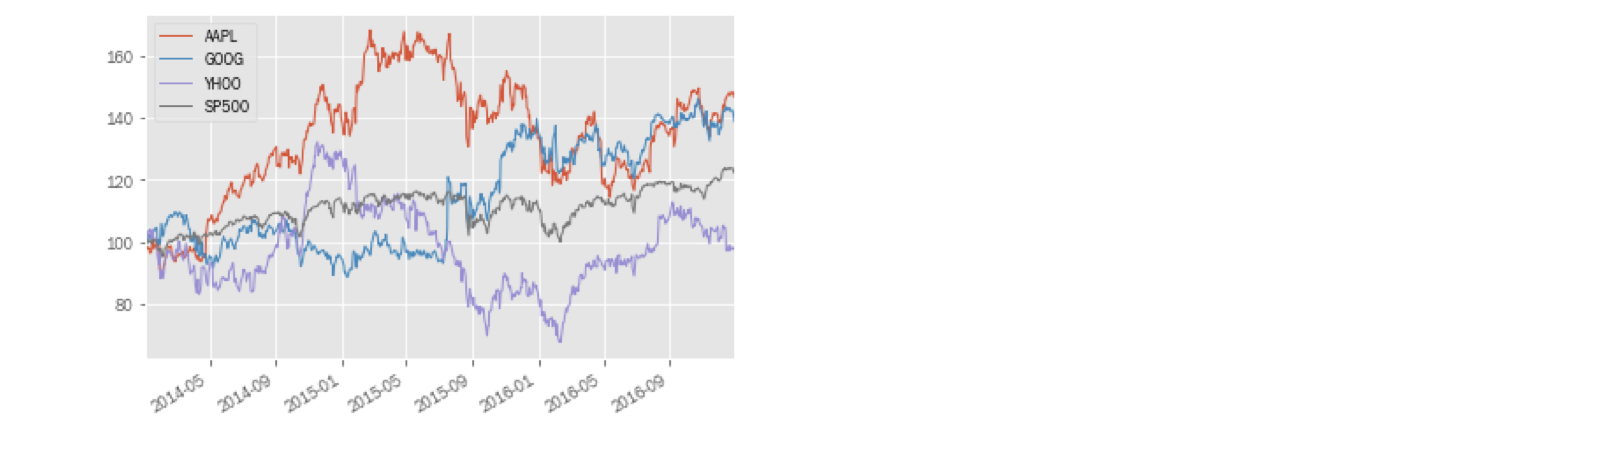
normalized = prices.div(prices.iloc[0]).mul(100)normalized.plot()
diff = normalized[tickers].sub(normalized['SP500'], axis=0)
GOOG YHOO AAPL
2010-01-04 0.000000 0.000000 0.000000
2010-01-05 -0.752375 0.448669 -0.115294
2010-01-06 -3.314604 0.043069 -1.772895
.sub(..., axis=0) : soustraire une Series de chaque colonne du DataFrame en alignant les indexdiff.plot()

Manipuler des séries chronologiques en Python