Créer des tableaux de bord avec Dash et Plotly
Alex Scriven
Data Scientist
$$
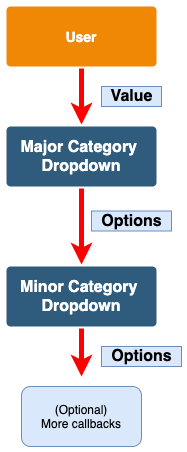
value
options
@callback(
  Output('minor_cat_dd', 'options'),
  Input('major_cat_dd', 'value'))

def update_major_cat(major_cat_dd):
    # Filter options (list of dicts)
    return minor_options
@callback( Output('minor_cat_dd', 'options'), Input('major_cat_dd', 'value'))
def update_major_cat(major_cat_dd): # Filter options (list of dicts) return minor_options
@callback(
  Output('minor_cat_dd', 'value'),
  Input('minor_cat_dd', 'options'))

def update_minor_cat(minor_cat_options):
    # Pick a default value
    return chosen_value
@callback( Output('minor_cat_dd', 'value'), Input('minor_cat_dd', 'options'))
def update_minor_cat(minor_cat_options): # Pick a default value return chosen_value
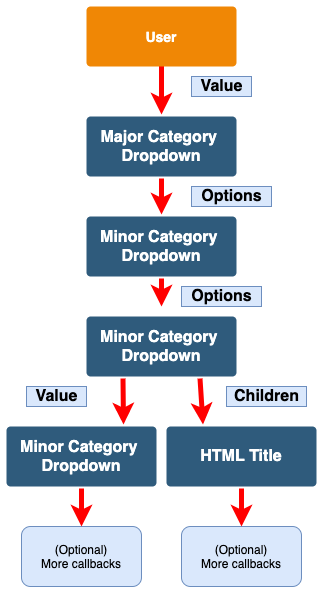
@callback(
  Output('my_title', 'children'),
  Output('minor_cat_dd', 'value'),
  Input('minor_cat_dd', 'options')
)
def some_function(input):
  # function body
  return title_value, dropdown_value