CSS avancé dans Dash
Créer des tableaux de bord avec Dash et Plotly

Alex Scriven
Data Scientist
CSS pour l'espacement entre objets
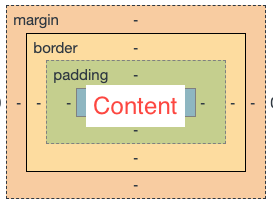
Le « modèle de boîte » voit chaque élément HTML comme une boîte à couches :
- Contenu de l'objet (propriétés
heightetwidth) - Remplissage (padding) — à l'extérieur du contenu
- Bordure — entre le remplissage et la marge
- Marge — à l'extérieur de la bordure, sépare les éléments
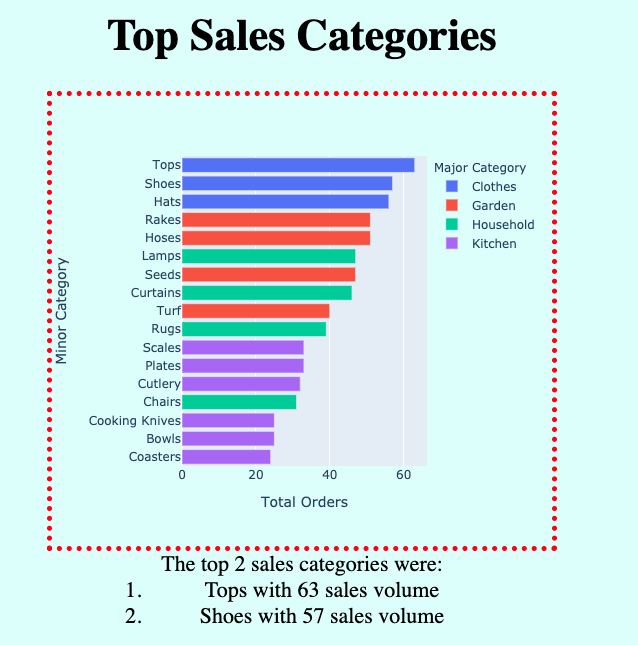
Une bordure dans notre appli
Espacement en CSS
$$
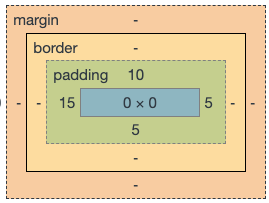
Ajouter du padding dans Dash
Aucun padding :
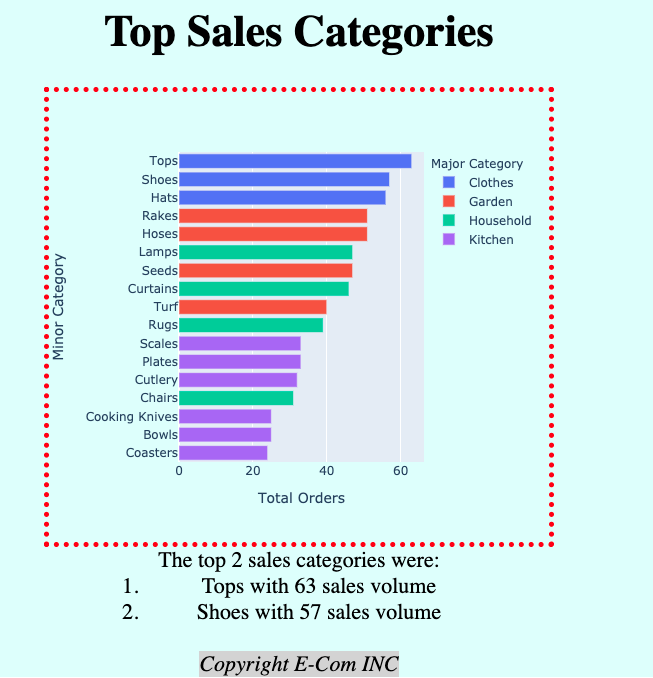
Ajout de 'padding':'100px' :
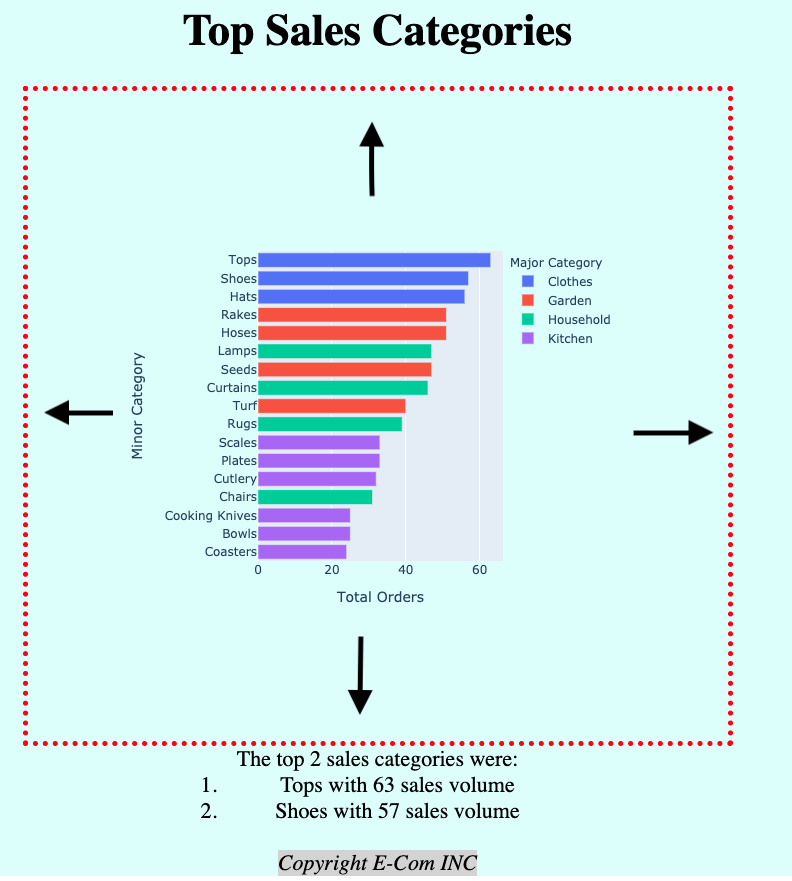
Ajouter une marge dans Dash
Aucune marge :
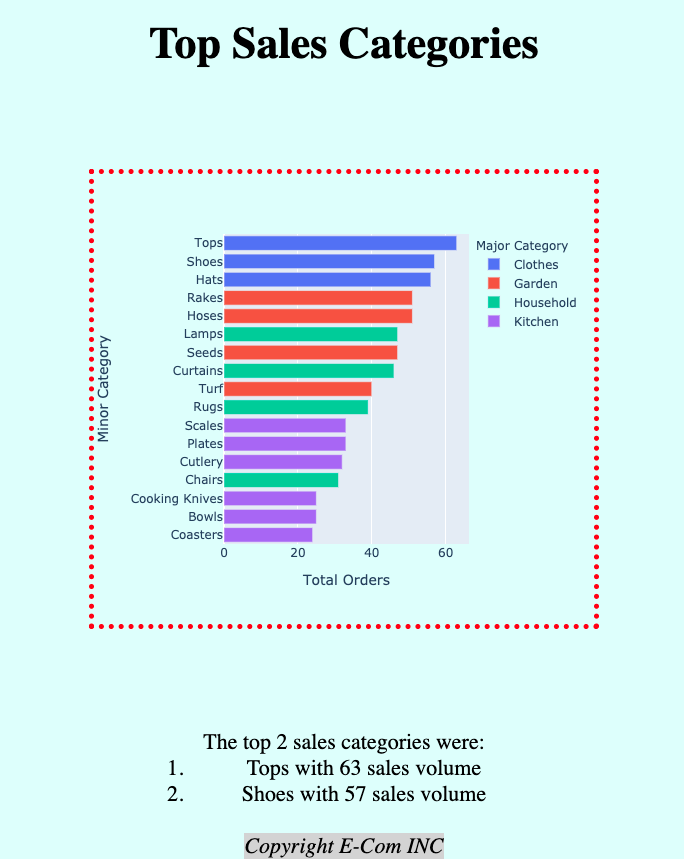
Ajout de margin: 100px auto :
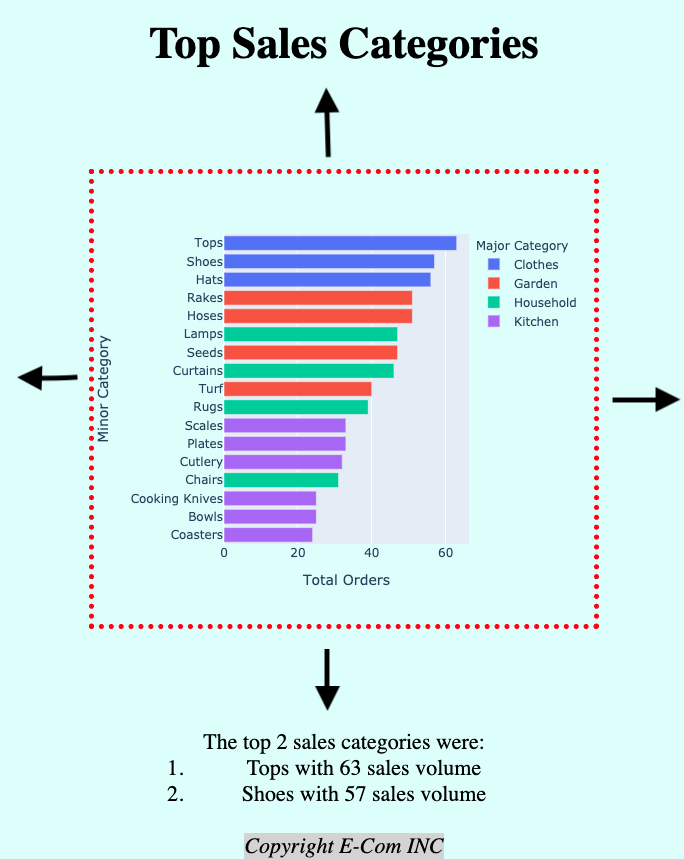
Centrer avec une marge auto
Avec : 'margin':'100px'
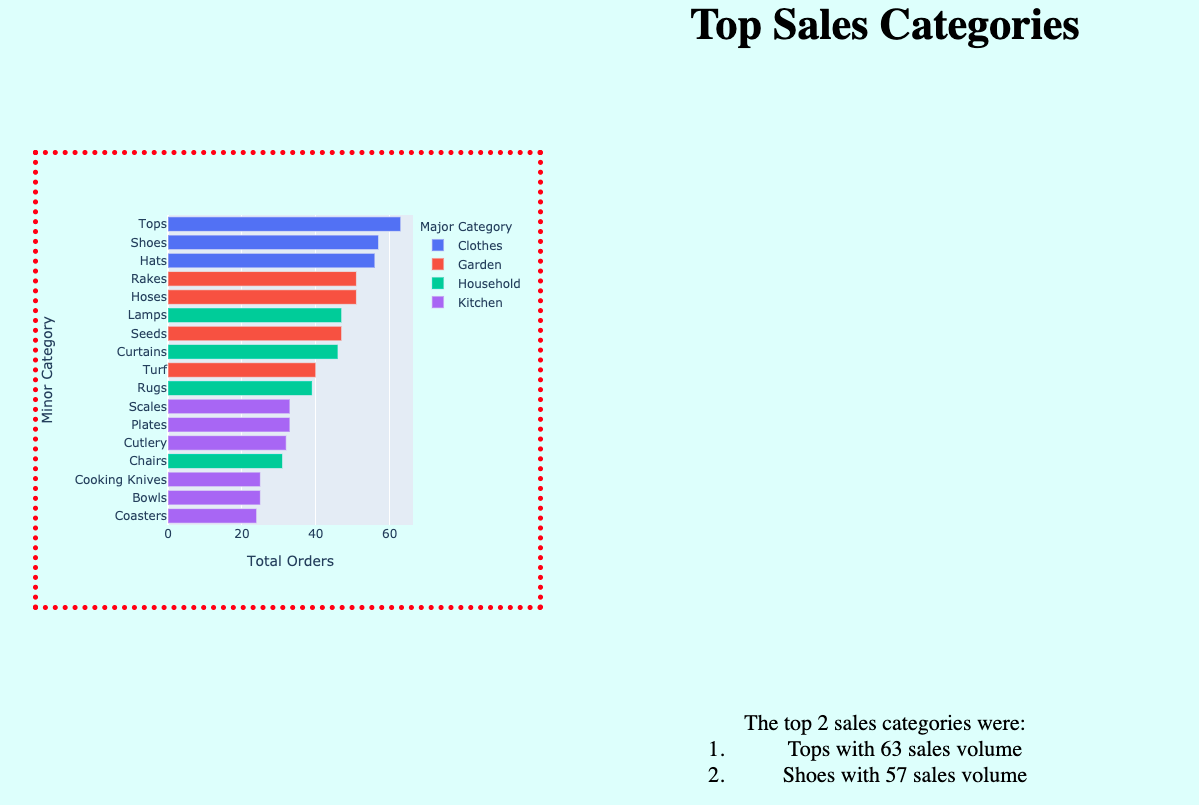
Avec : 'margin':'100px auto'
Éléments inline-block
$$