Distributions: part one
Visualization Best Practices in R

Nick Strayer
Instructor
What is distribution data?
- Multiple 'observations'
- Usually a sample of some population

Why distributions are important
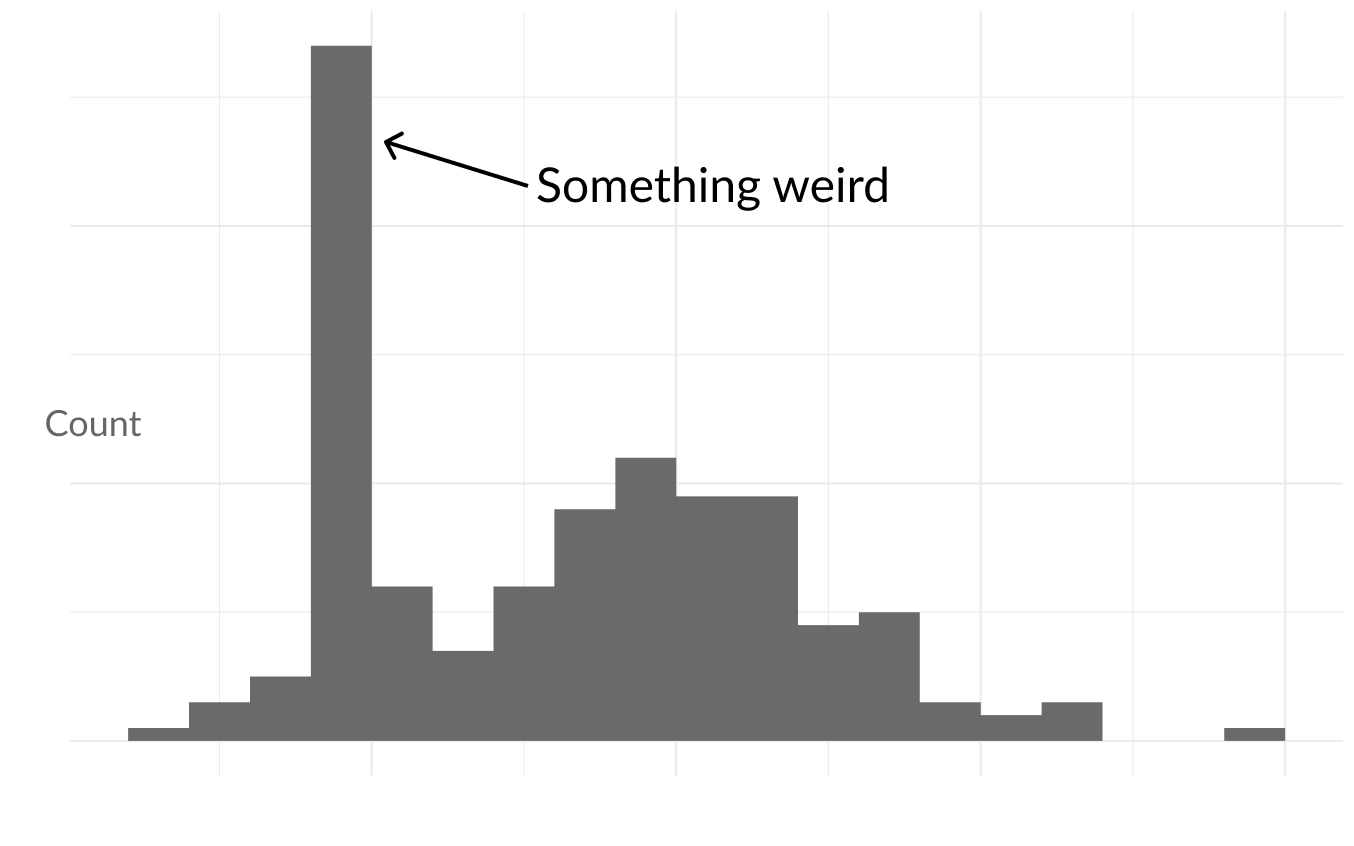
- Data collection or cleaning errors can become apparent
- Could indicate the need to control for a variable in a model
- Being true to the data
Standard plots
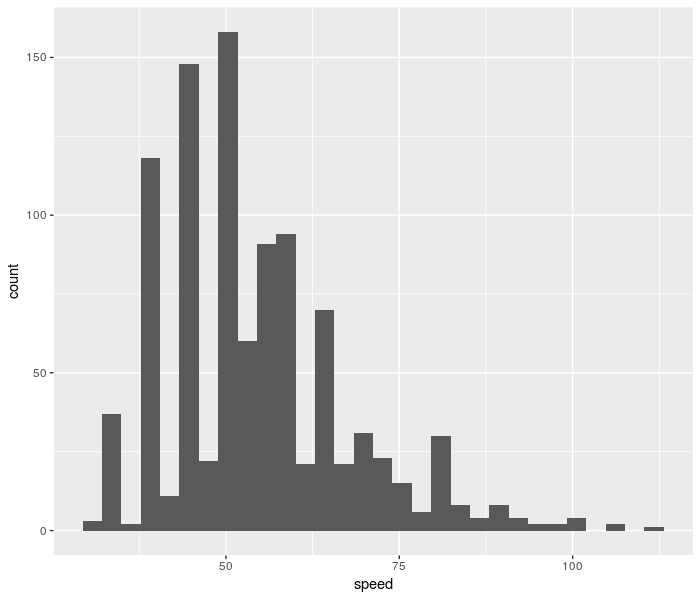
Histogram
- Good for one distribution at a time
- This chapter

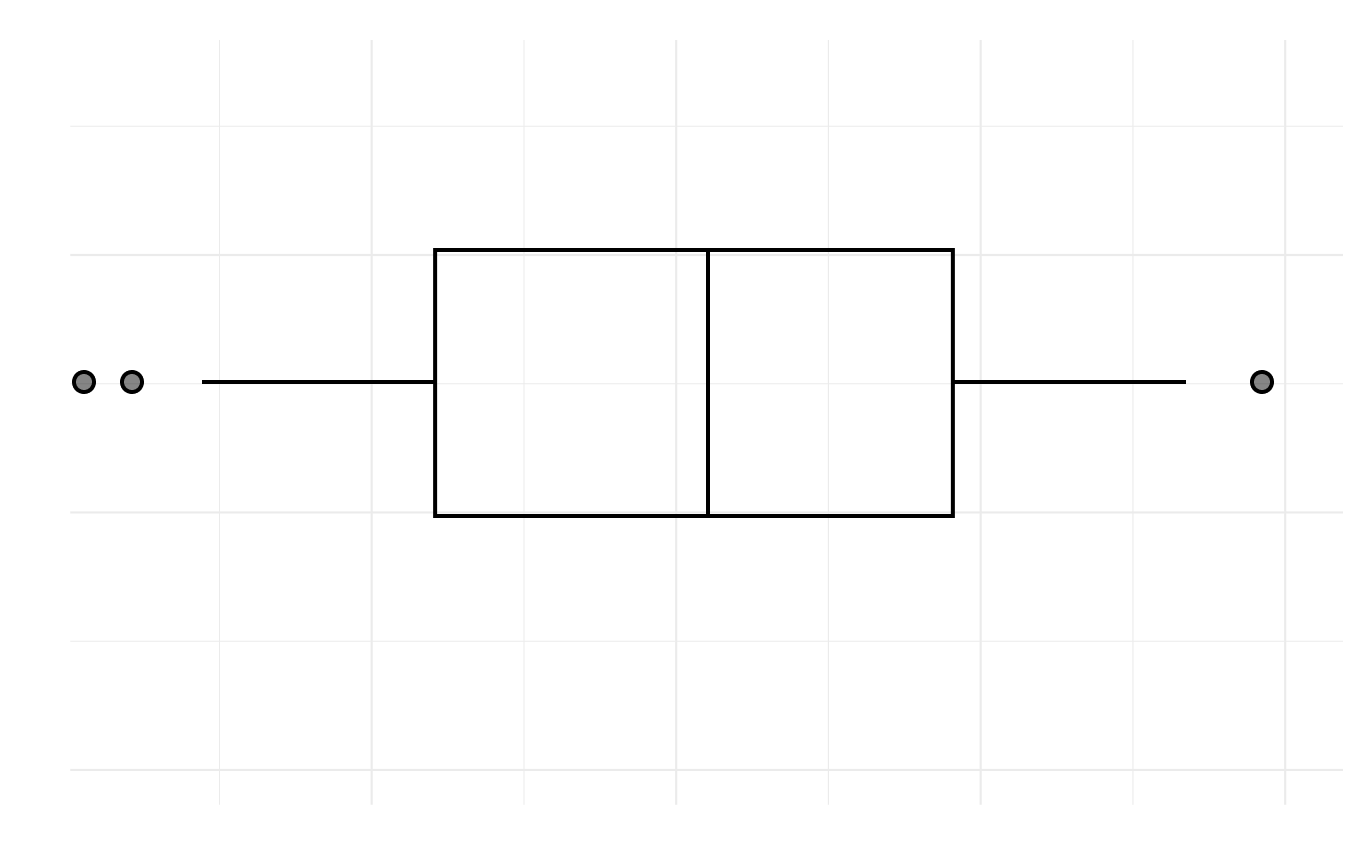
boxplot
- For comparing multiple distributions
- Next chapter
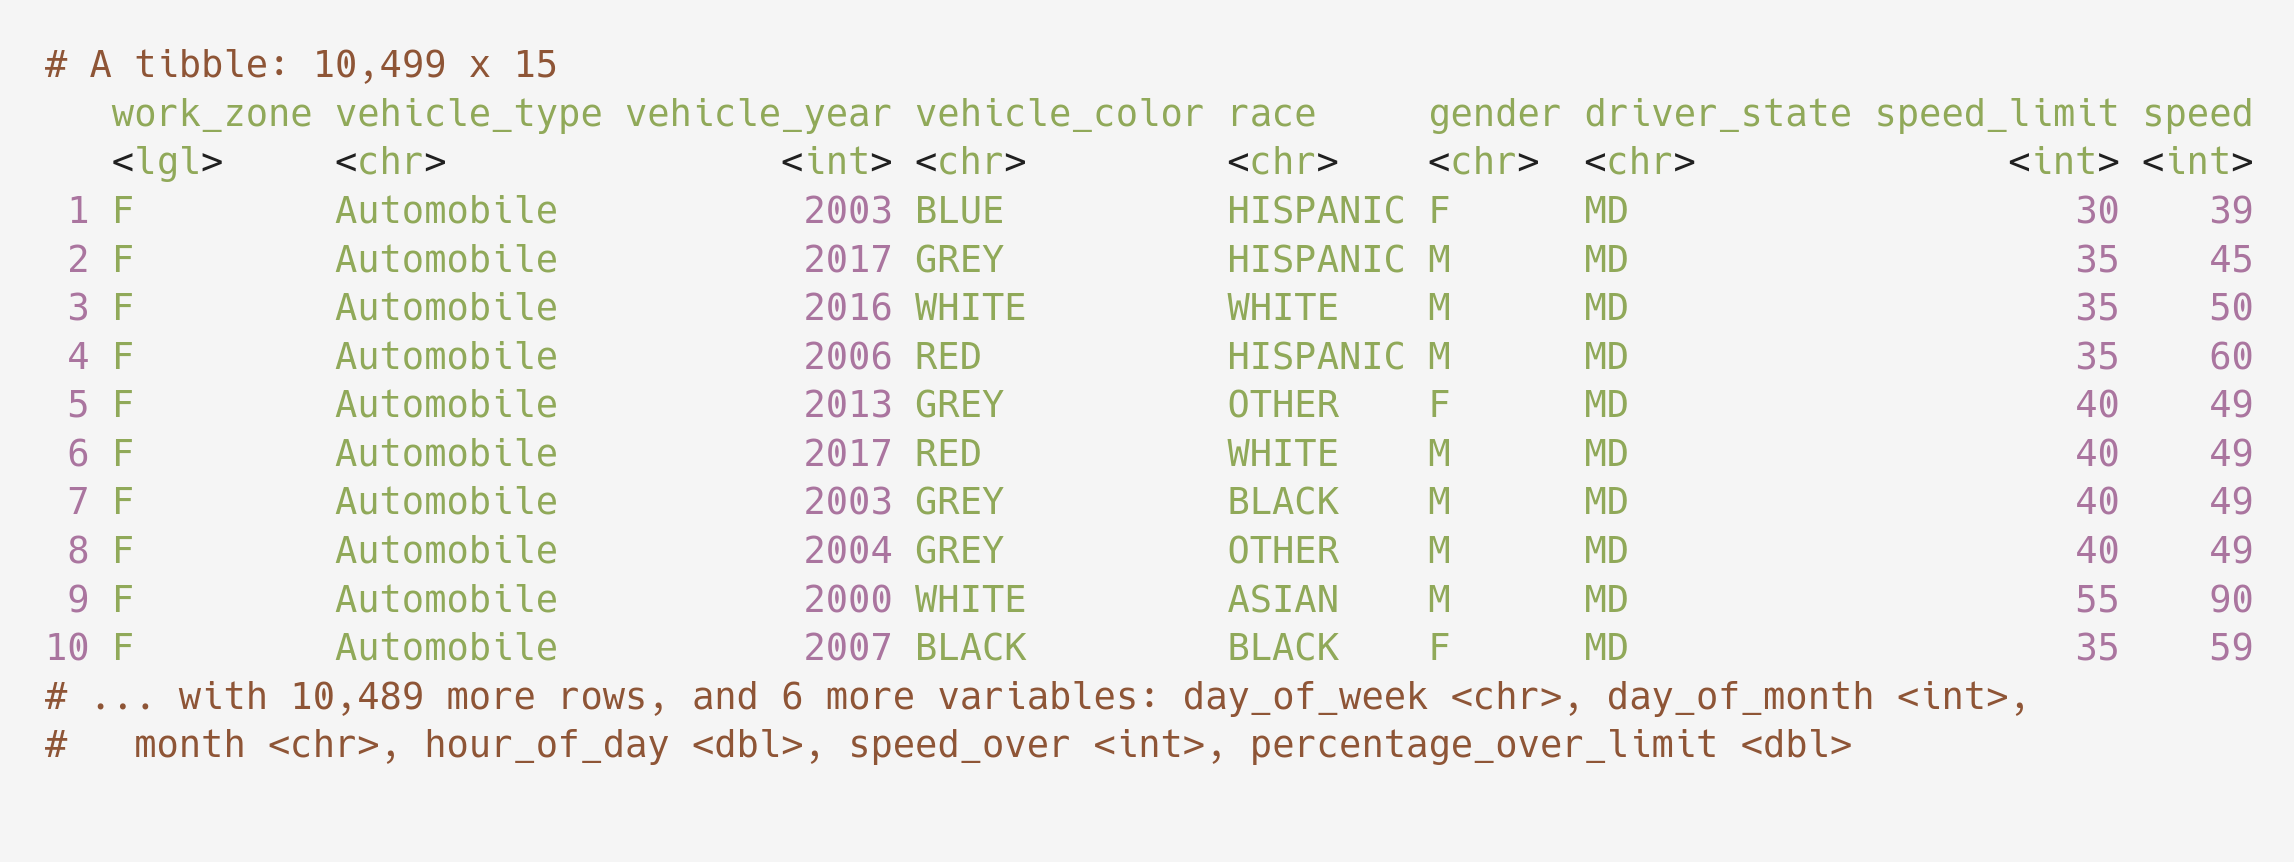
Maryland speeding data
- Speeding tickets given in Mongomery County, Maryland for 2017
- Retrieved from data.montgomerycountymd.gov
md_speeding