Histogram nuances
Visualization Best Practices in R

Nick Strayer
Instructor
Histogram positives
- Intuitive
- Interpretable
Histogram negatives
- Sensitive to bin placements
- Iffy with small amounts of data
Adjusting number of bins
- Exact same data
- Varying bin-numbers (
geom_histogram(bins = n))) from 10 to 55
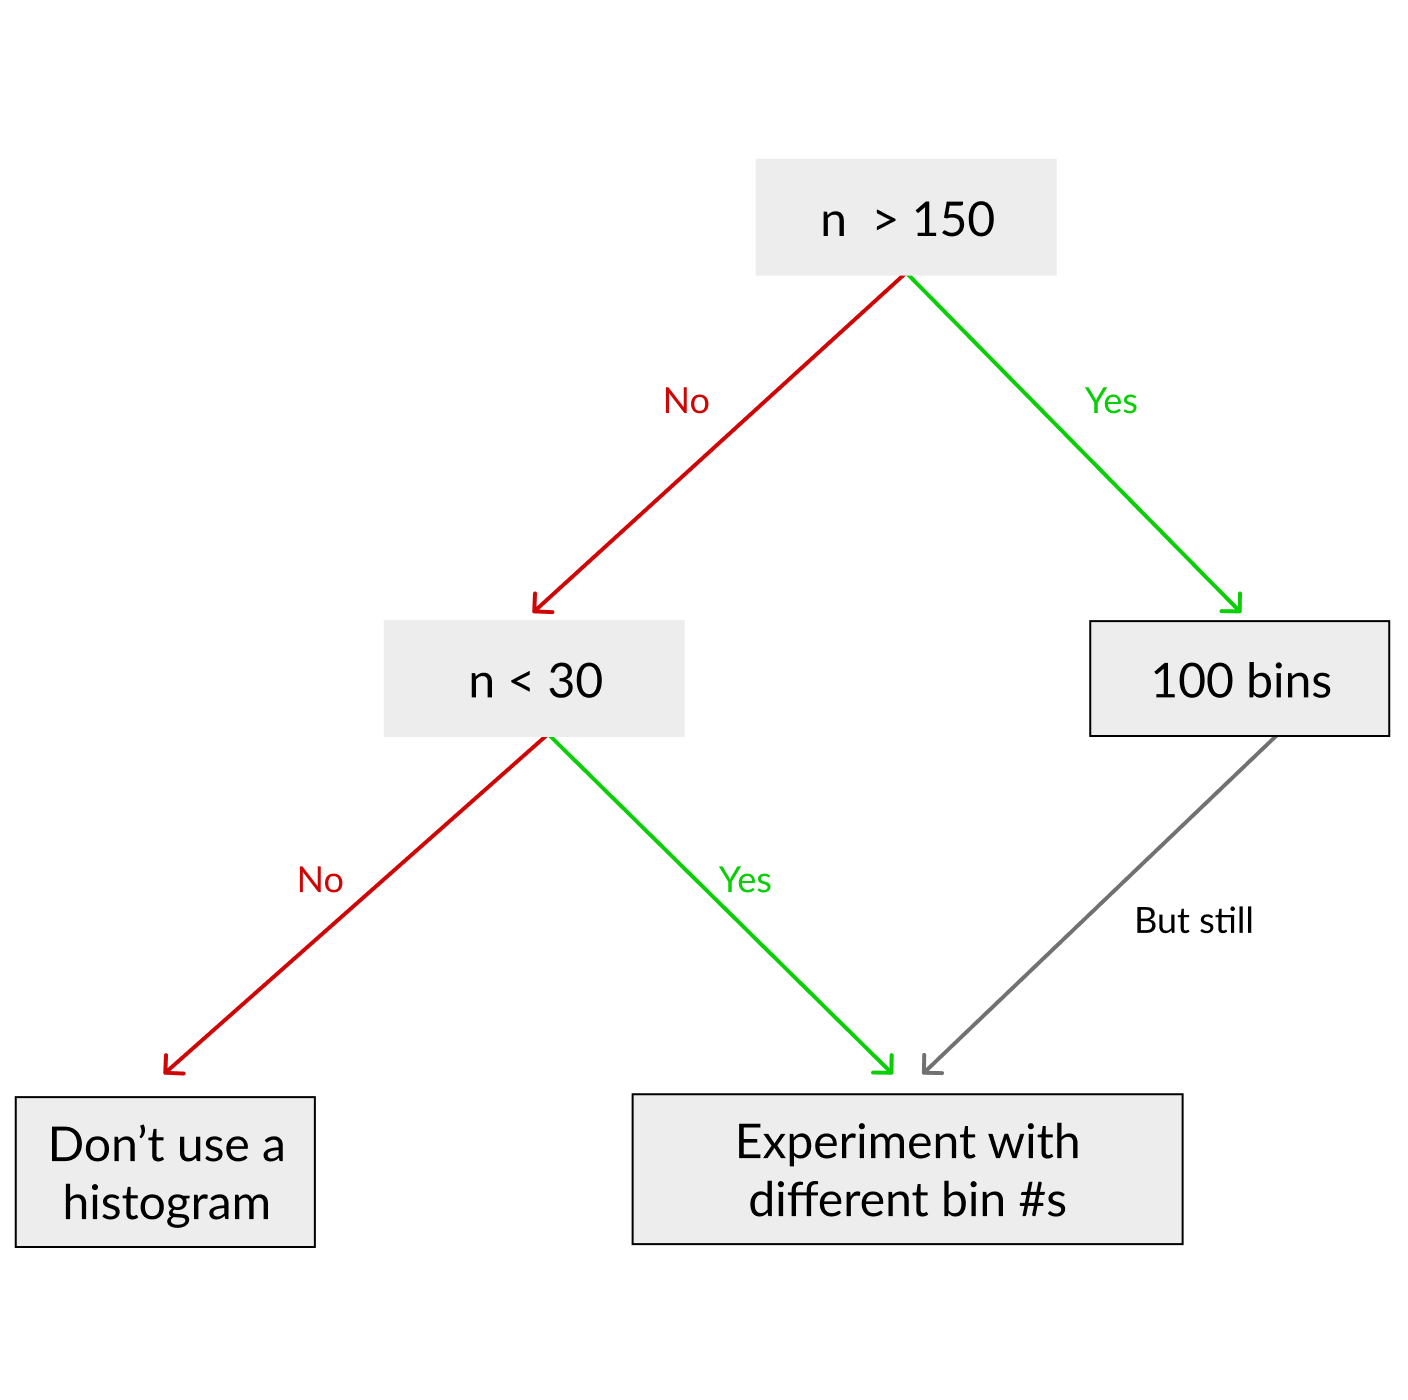
Bin number best practices
- If
length(data$x) > 150→bins = 100 - Otherwise, play around to get a good sense of the data
Reality
- Beware of digit preferences
- Data from automated sources are less likely to be problematic