Prédire des pentes parallèles
Régression intermédiaire avec statsmodels en Python

Maarten Van den Broeck
Content Developer at DataCamp
Le flux de prédiction
import pandas as pd
import numpy as np
expl_data_length = pd.DataFrame(
  {"length_cm": np.arange(5, 61, 5)})
print(expl_data_length)
    length_cm
0           5
1          10
2          15
3          20
4          25
5          30
6          35
7          40
8          45
9          50
10         55
11         60
Le flux de prédiction
[A, B, C] x [1, 2] ==> [A1, B1, C1, A2, B2, C2]
from itertools import productproduct(["A", "B", "C"], [1, 2])
length_cm = np.arange(5, 61, 5)species = fish["species"].unique()p = product(length_cm, species)expl_data_both = pd.DataFrame(p, columns=['length_cm', 'species'])print(expl_data_both)
    length_cm species
0           5   Bream
1           5   Roach
2           5   Perch
3           5    Pike
4          10   Bream
5          10   Roach
6          10   Perch
...
41         55   Roach
42         55   Perch
43         55    Pike
44         60   Bream
45         60   Roach
46         60   Perch
47         60    Pike
Le flux de prédiction
Prédire mass_g à partir de length_cm seulement
prediction_data_length = expl_data_length.assign(
    mass_g = mdl_mass_vs_length.predict(expl_data)
)
Prédire mass_g à partir des deux variables explicatives
prediction_data_both = expl_data_both.assign(
    mass_g = mdl_mass_vs_both.predict(expl_data)
)
    length_cm     mass_g
0           5  -361.7277
1          10  -187.2315
2          15   -12.7353
3          20   161.7610
4          25   336.2572
5          30   510.7534
... # number of rows: 12
    length_cm species     mass_g
0           5   Bream  -459.3991
1           5   Roach  -513.9350
2           5   Perch  -500.4501
3           5    Pike  -876.6133
4          10   Bream  -246.5563
5          10   Roach  -301.0923
... # number of rows: 48
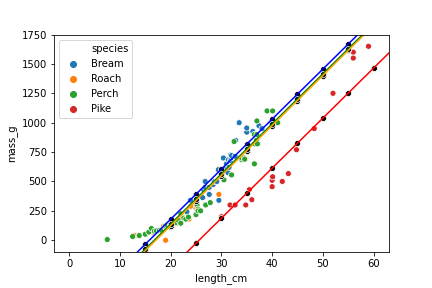
Visualiser les prédictions
plt.axline(xy1=(0, ic_bream), slope=sl, color="blue")
plt.axline(xy1=(0, ic_perch), slope=sl, color="green")
plt.axline(xy1=(0, ic_pike), slope=sl, color="red")
plt.axline(xy1=(0, ic_roach), slope=sl, color="orange")

sns.scatterplot(x="length_cm",
                y="mass_g",
                hue="species",
                data=fish)
sns.scatterplot(x="length_cm",
                y="mass_g",
                color="black",
                data=prediction_data)
Calculer manuellement des prédictions pour une régression linéaire
coeffs = mdl_mass_vs_length.params
print(coeffs)
intercept, slope = coeffs
explanatory_data = pd.DataFrame(
{"length_cm": np.arange(5, 61, 5)})

prediction_data = explanatory_data.assign(
    mass_g = intercept + slope * explanatory_data
    )
print(prediction_data)
Intercept   -536.223947
length_cm     34.899245
    length_cm       mass_g
0           5  -361.727721
1          10  -187.231494
2          15   -12.735268
3          20   161.760959
4          25   336.257185
5          30   510.753412
...
9          50  1208.738318
10         55  1383.234545
11         60  1557.730771
Calculer manuellement des prédictions pour une régression multiple
coeffs = mdl_mass_vs_both.params
print(coeffs)
species[Bream]    -672.241866
species[Perch]    -713.292859
species[Pike]    -1089.456053
species[Roach]    -726.777799
length_cm           42.568554
ic_bream, ic_perch, ic_pike, ic_roach, slope = coeffs
np.select()
conditions = [
      condition_1,
      condition_2,
      # ...
      condition_n
]

choices = [list_of_choices] # same length as conditions

np.select(conditions, choices)
Choisir une ordonnée à l'origine avec np.select()
conditions = [
    explanatory_data["species"] == "Bream",
    explanatory_data["species"] == "Perch",
    explanatory_data["species"] == "Pike",
    explanatory_data["species"] == "Roach"
]
choices = [ic_bream, ic_perch, ic_pike, ic_roach]
intercept = np.select(conditions, choices)
print(intercept)
[ -672.24  -726.78  -713.29 -1089.46
  -672.24  -726.78  -713.29 -1089.46
  -672.24  -726.78  -713.29 -1089.46
  -672.24  -726.78  -713.29 -1089.46
  -672.24  -726.78  -713.29 -1089.46
  -672.24  -726.78  -713.29 -1089.46
  -672.24  -726.78  -713.29 -1089.46
  -672.24  -726.78  -713.29 -1089.46
  -672.24  -726.78  -713.29 -1089.46
  -672.24  -726.78  -713.29 -1089.46
  -672.24  -726.78  -713.29 -1089.46
  -672.24  -726.78  -713.29 -1089.46]
L'étape finale de prédiction
prediction_data = explanatory_data.assign( intercept = np.select(conditions, choices), mass_g = intercept + slope * explanatory_data["length_cm"])print(prediction_data)
    length_cm species  intercept     mass_g
0           5   Bream  -672.2419  -459.3991
1           5   Roach  -726.7778  -513.9350
2           5   Perch  -713.2929  -500.4501
3           5    Pike -1089.4561  -876.6133
4          10   Bream  -672.2419  -246.5563
5          10   Roach  -726.7778  -301.0923
6          10   Perch  -713.2929  -287.6073
7          10    Pike -1089.4561  -663.7705
8          15   Bream  -672.2419   -33.7136
...
40         55   Bream  -672.2419  1669.0286
41         55   Roach  -726.7778  1614.4927
42         55   Perch  -713.2929  1627.9776
43         55    Pike -1089.4561  1251.8144
44         60   Bream  -672.2419  1881.8714
45         60   Roach  -726.7778  1827.3354
46         60   Perch  -713.2929  1840.8204
47         60    Pike -1089.4561  1464.6572
Comparer à .predict()
mdl_mass_vs_both.predict(explanatory_data)
0     -459.3991
1     -513.9350
2     -500.4501
3     -876.6133
4     -246.5563
5     -301.0923
...
43    1251.8144
44    1881.8714
45    1827.3354
46    1840.8204
47    1464.6572
Passons à la pratique !
Régression intermédiaire avec statsmodels en Python

