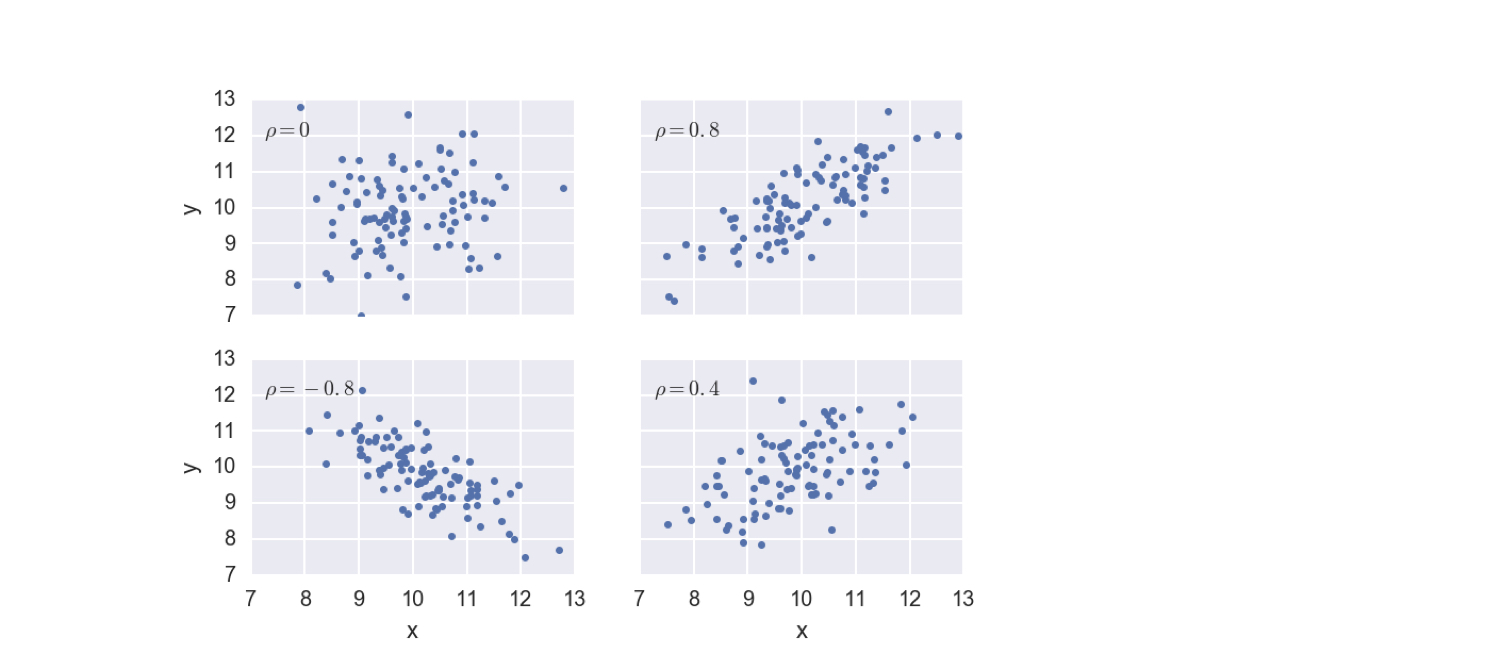
Covariance et coefficient de corrélation de Pearson
Réflexion statistique en Python (Partie 1)

Justin Bois
Teaching Professor at the California Institute of Technology
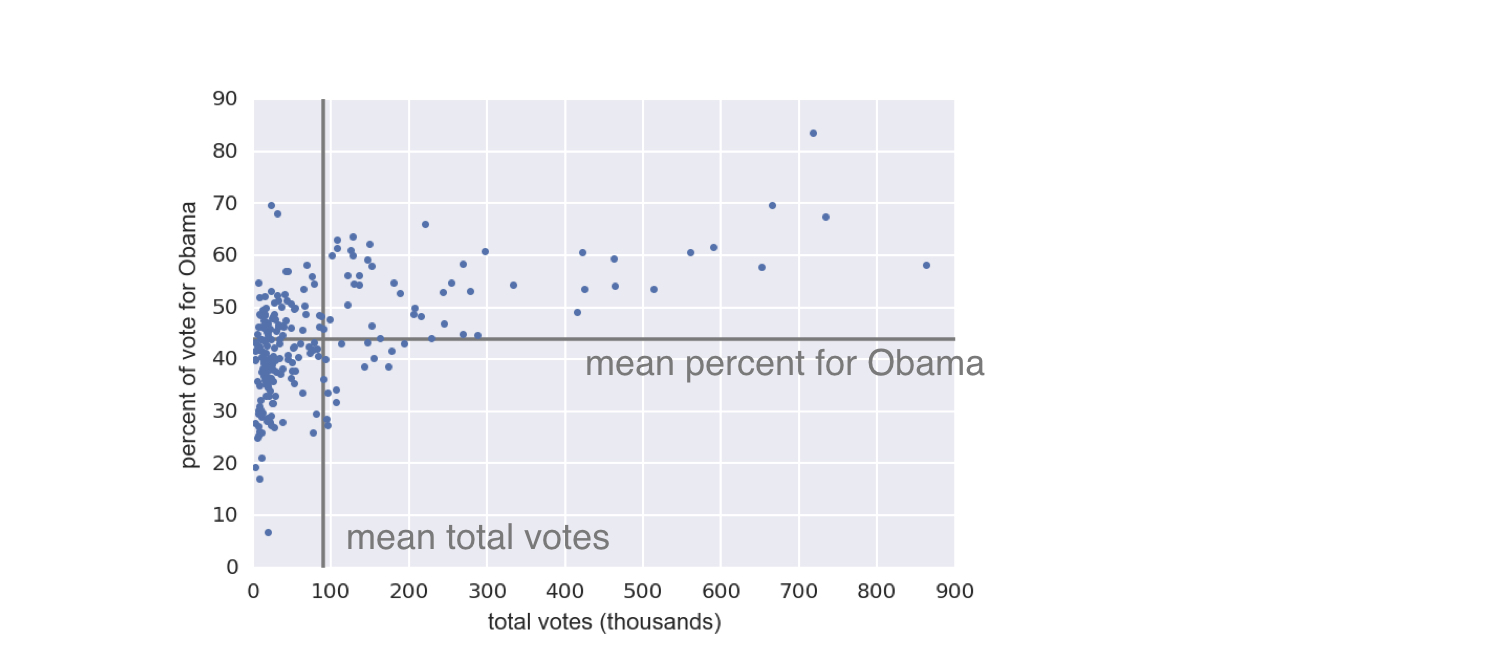
Résultats des élections dans les États pivot américains, 2008
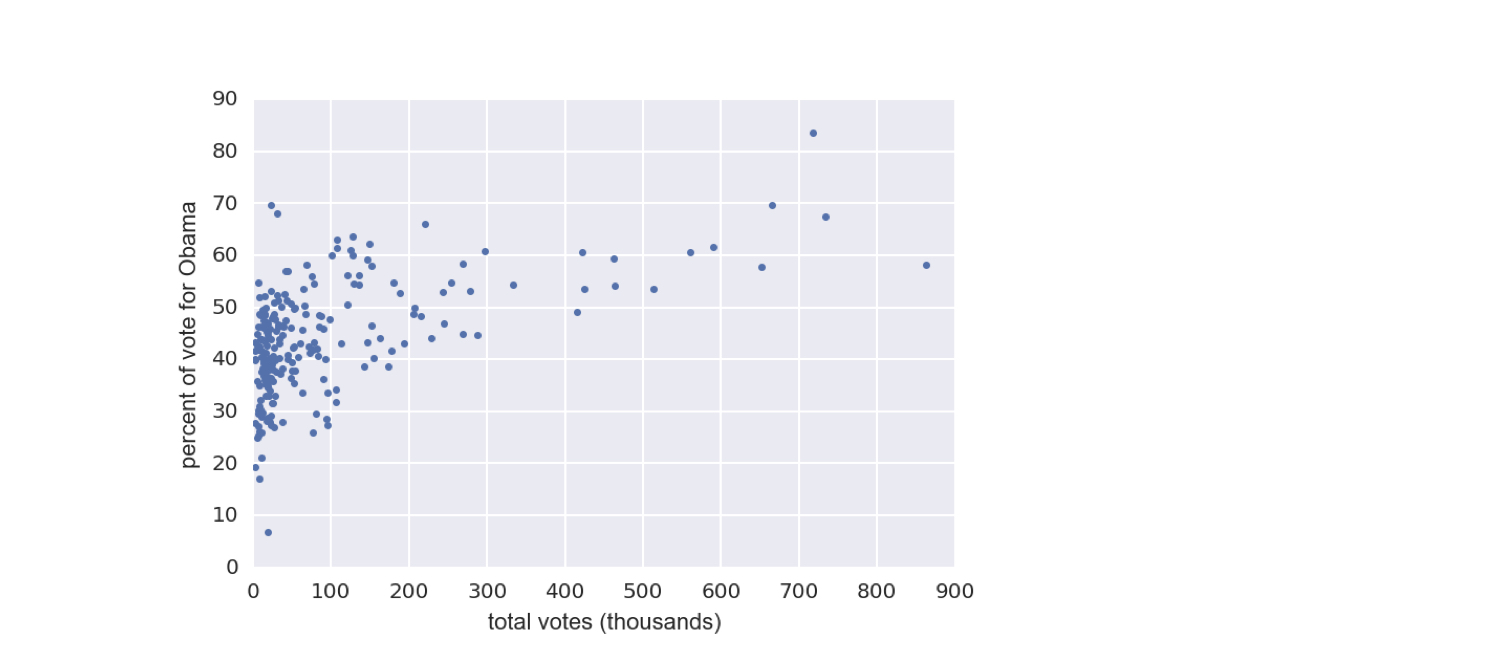
1 Données obtenues sur Data.gov (https://www.data.gov/)
Résultats des élections dans les États pivot américains, 2008
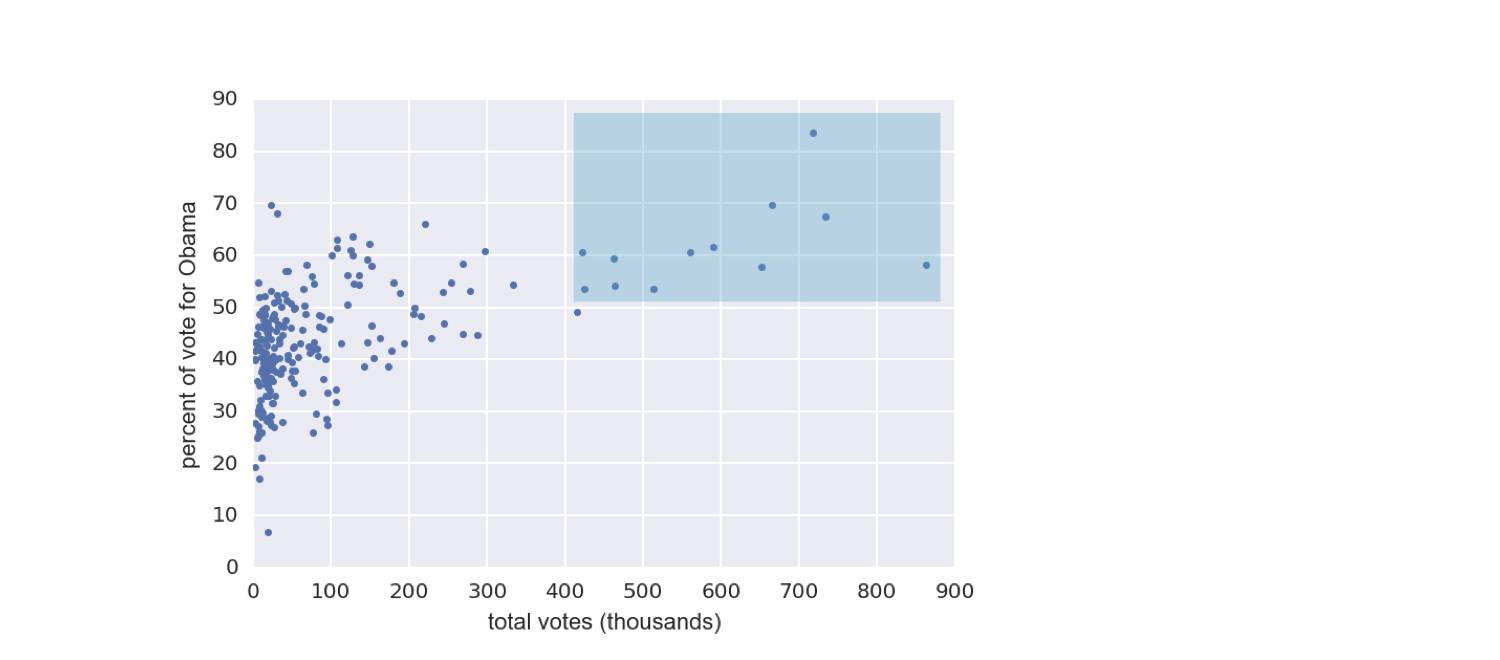
1 Données obtenues sur Data.gov (https://www.data.gov/)
Résultats des élections dans les États pivot américains, 2008
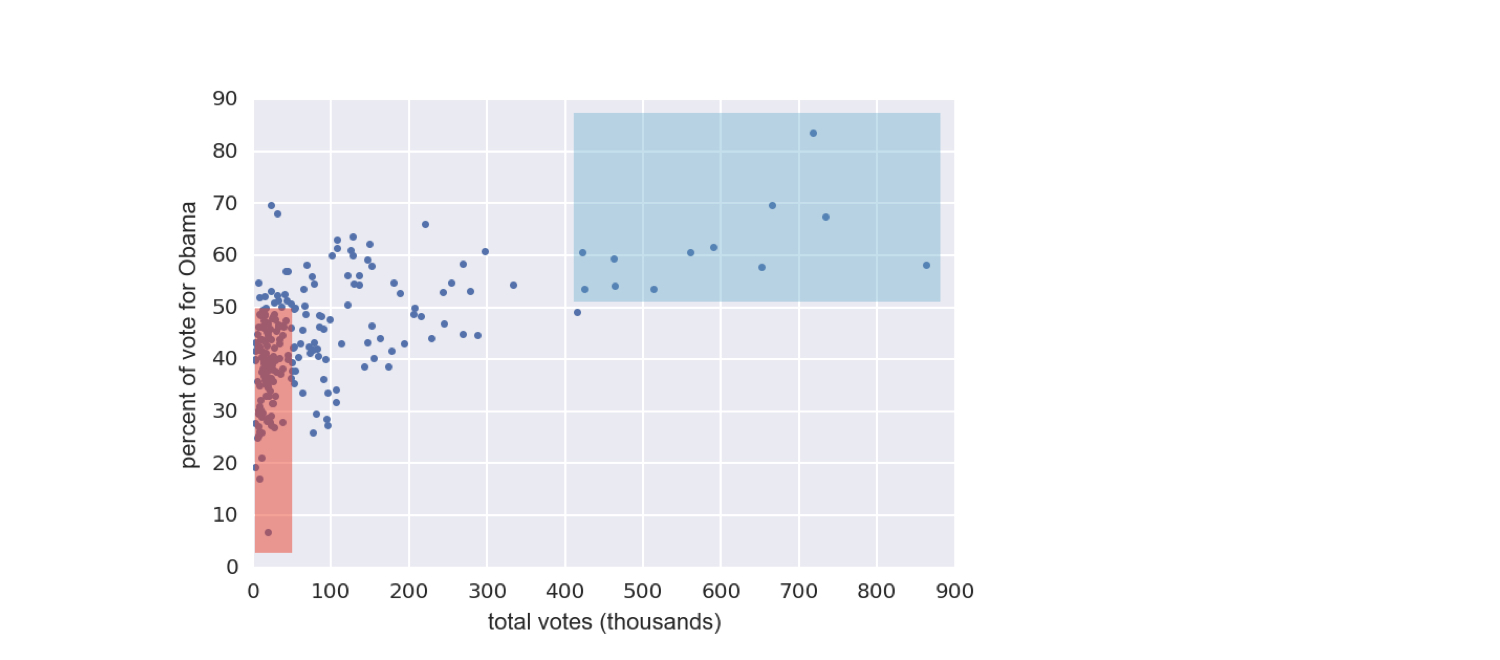
1 Données obtenues sur Data.gov (https://www.data.gov/)
Calcul de la covariance
1 Données obtenues sur Data.gov (https://www.data.gov/)
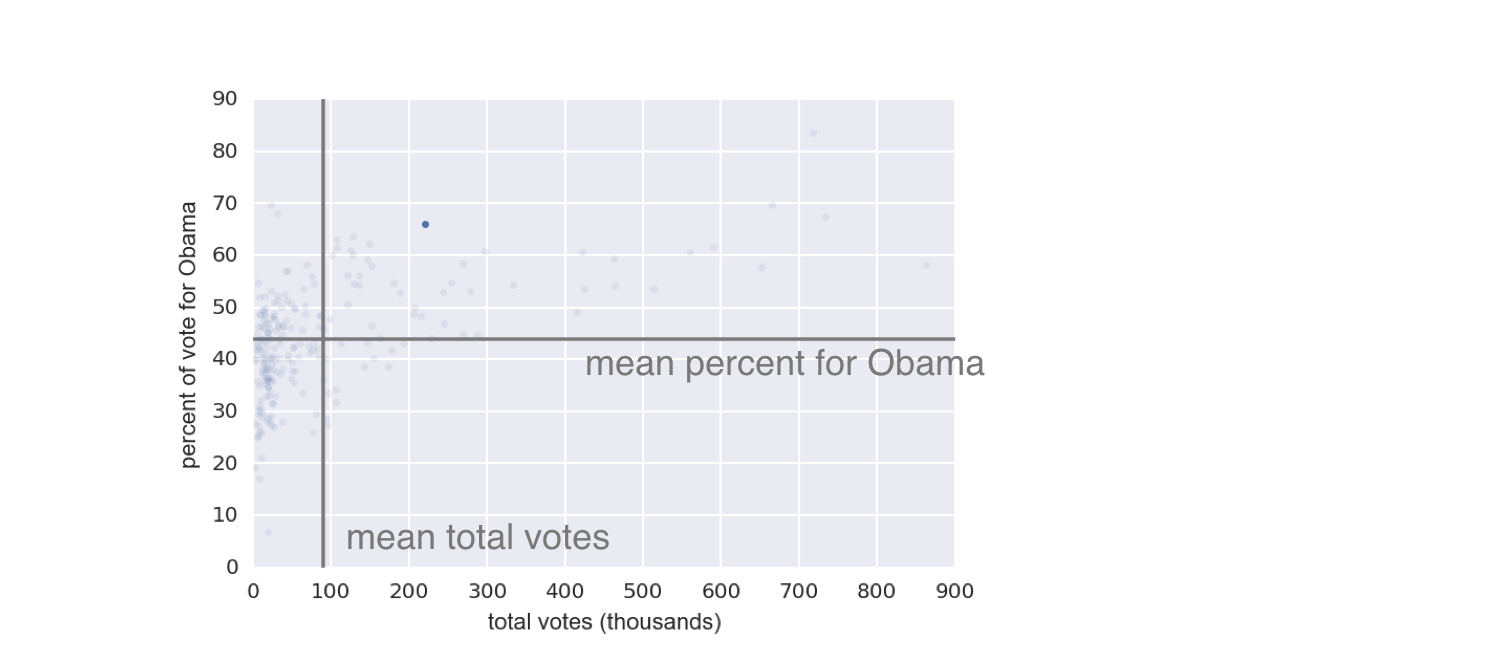
Calcul de la covariance
1 Données obtenues sur Data.gov (https://www.data.gov/)
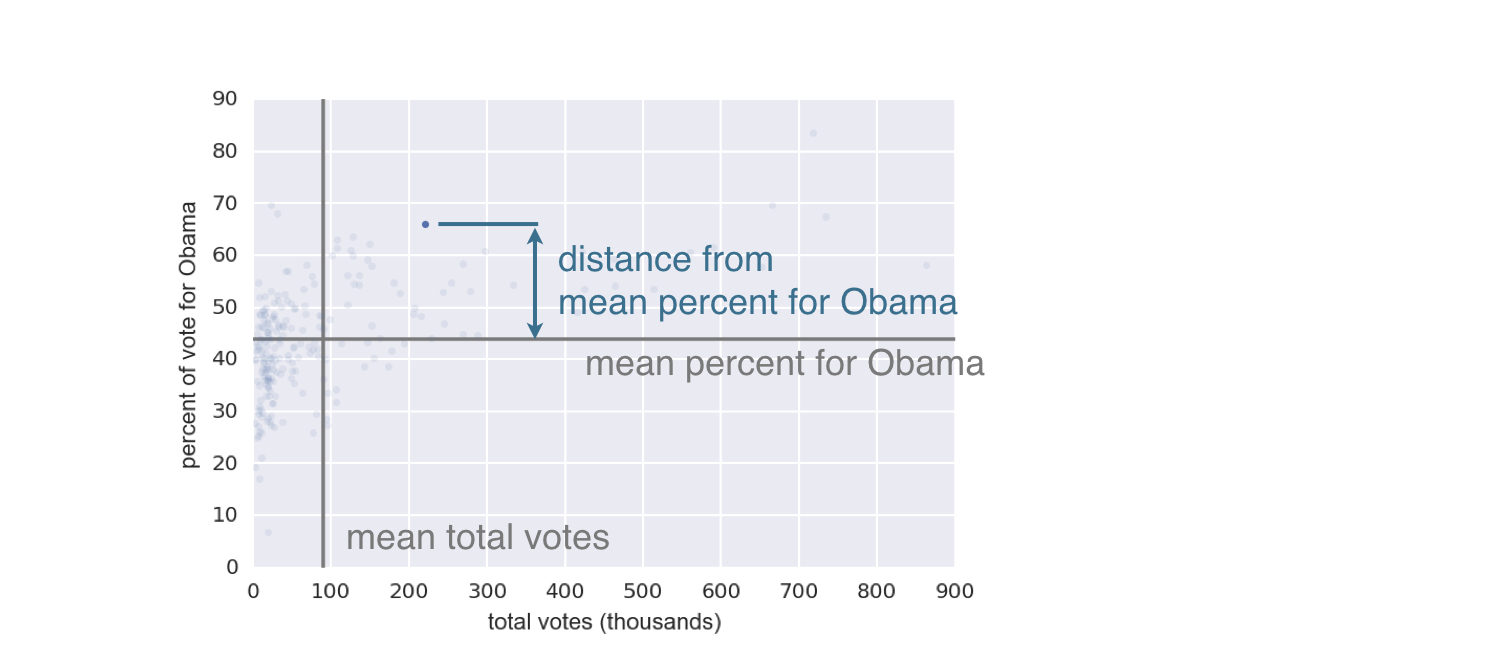
Calcul de la covariance
1 Données obtenues sur Data.gov (https://www.data.gov/)
Calcul de la covariance
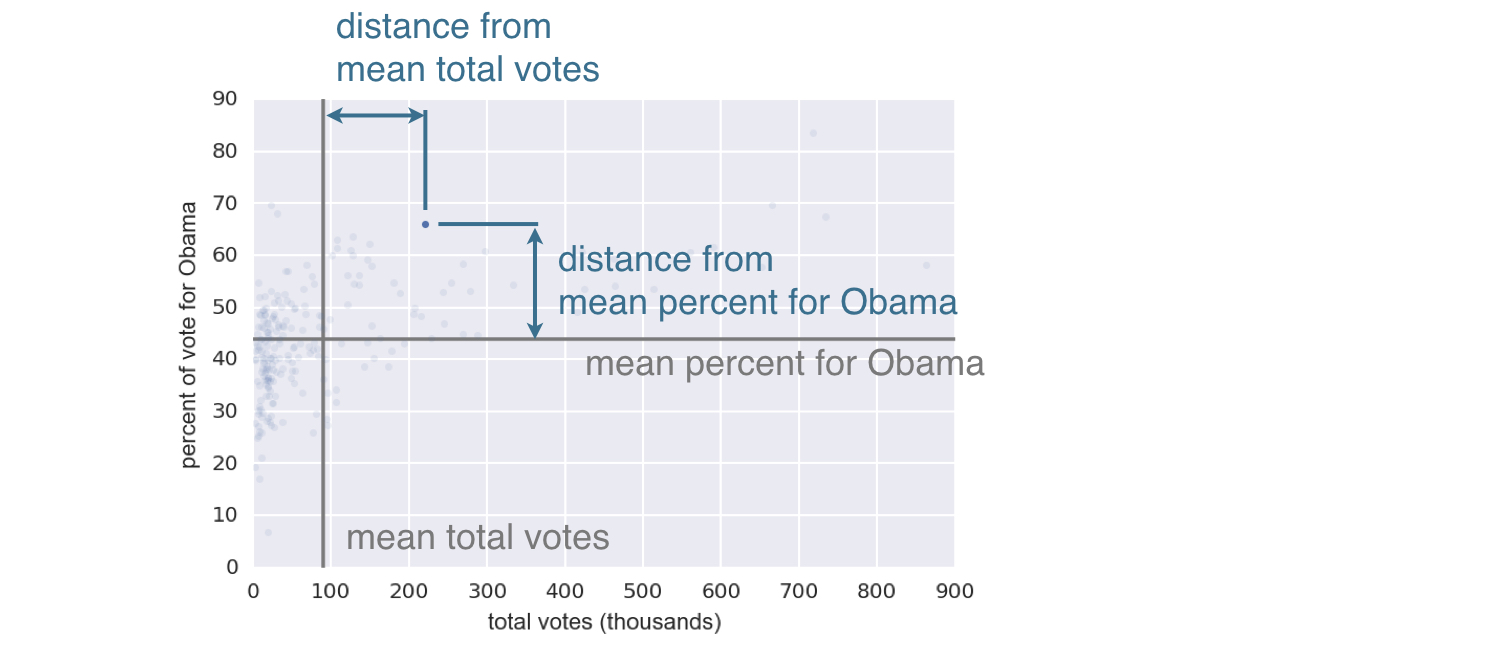
$$covariance = \frac{1}{n}\sum_{i=1}^{n}(x_i - \bar{x})(y_i - \bar{y})$$
1 Données obtenues sur Data.gov (https://www.data.gov/)
Exemples de coefficient de corrélation de Pearson