Centiles, valeurs aberrantes et boîtes à moustaches

Réflexion statistique en Python (Partie 1)

Justin Bois

Teaching Professor at the California Institute of Technology

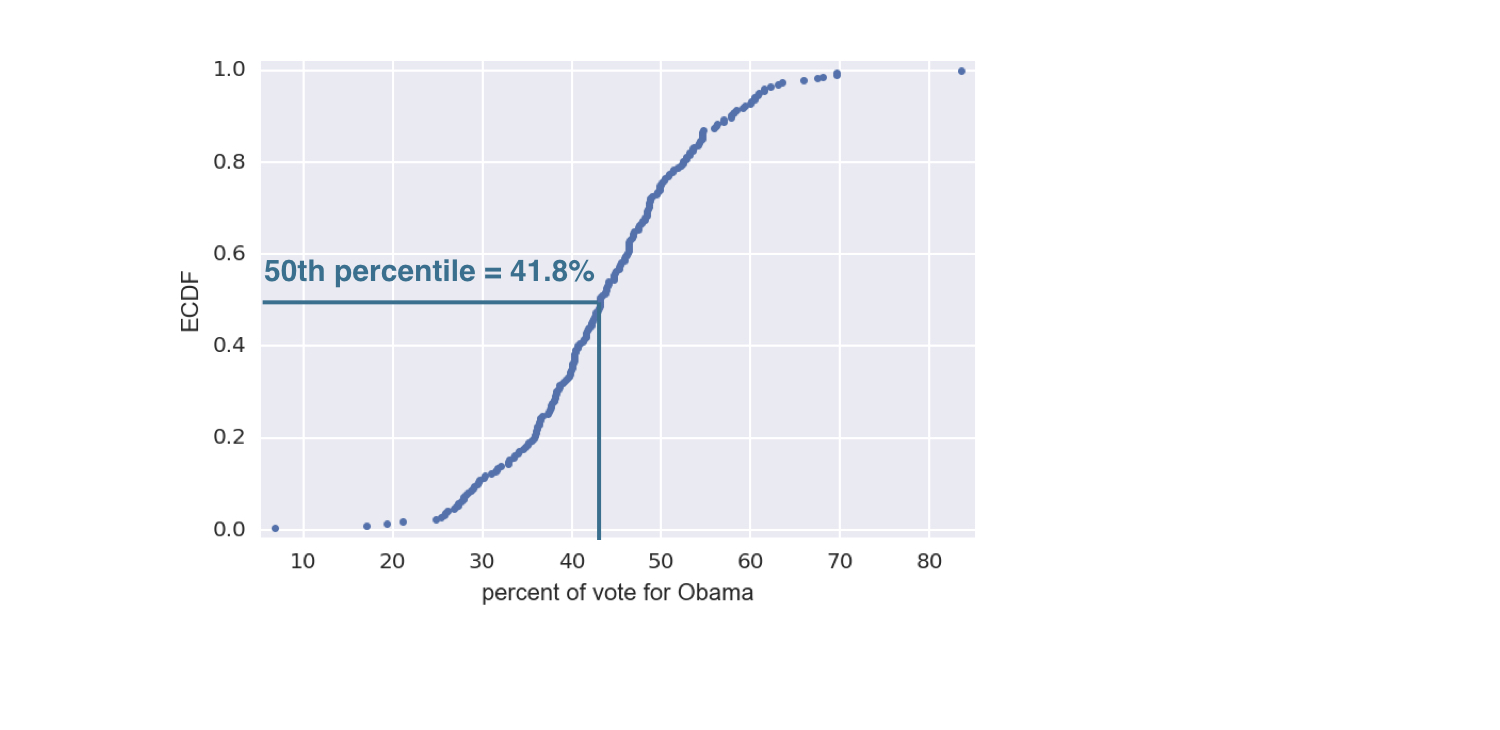
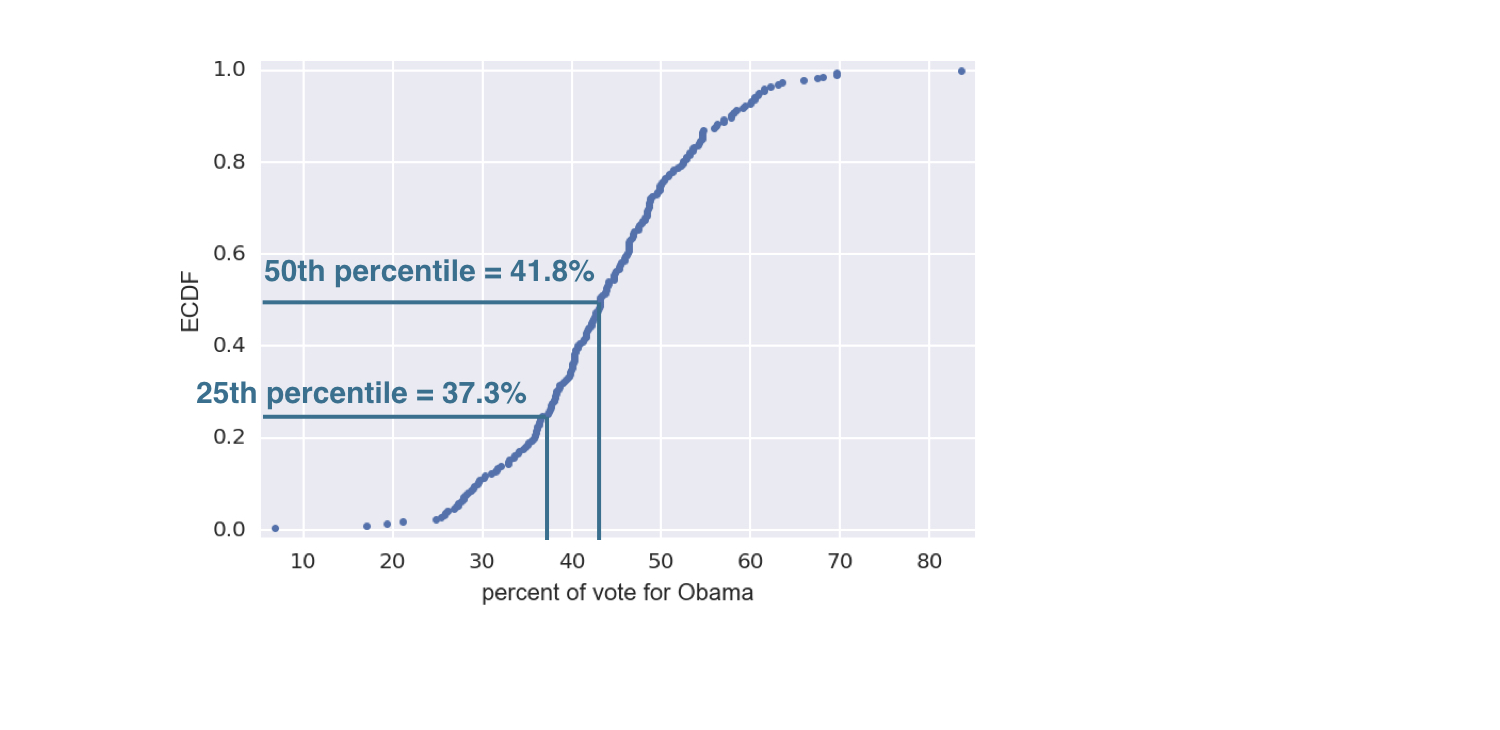
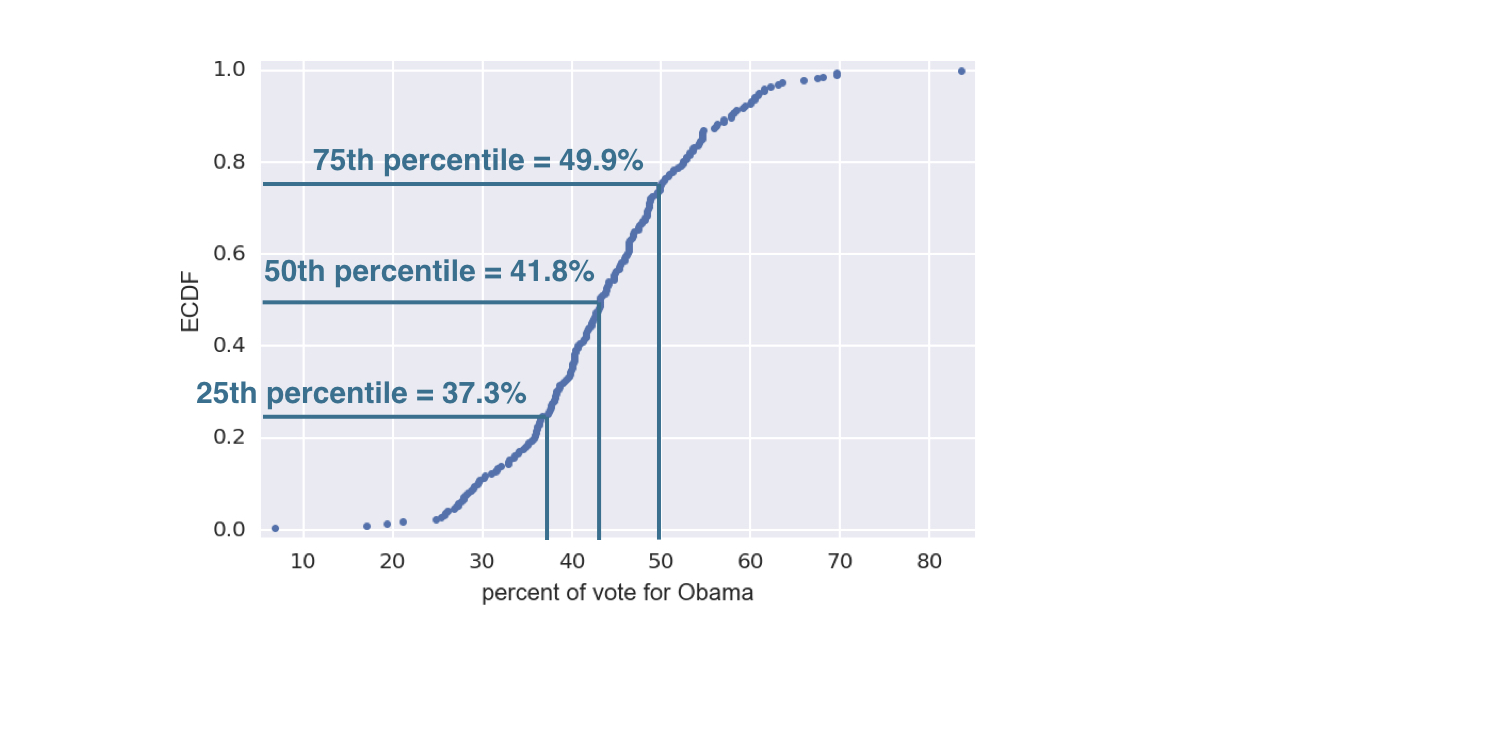
Centiles sur une ECDF
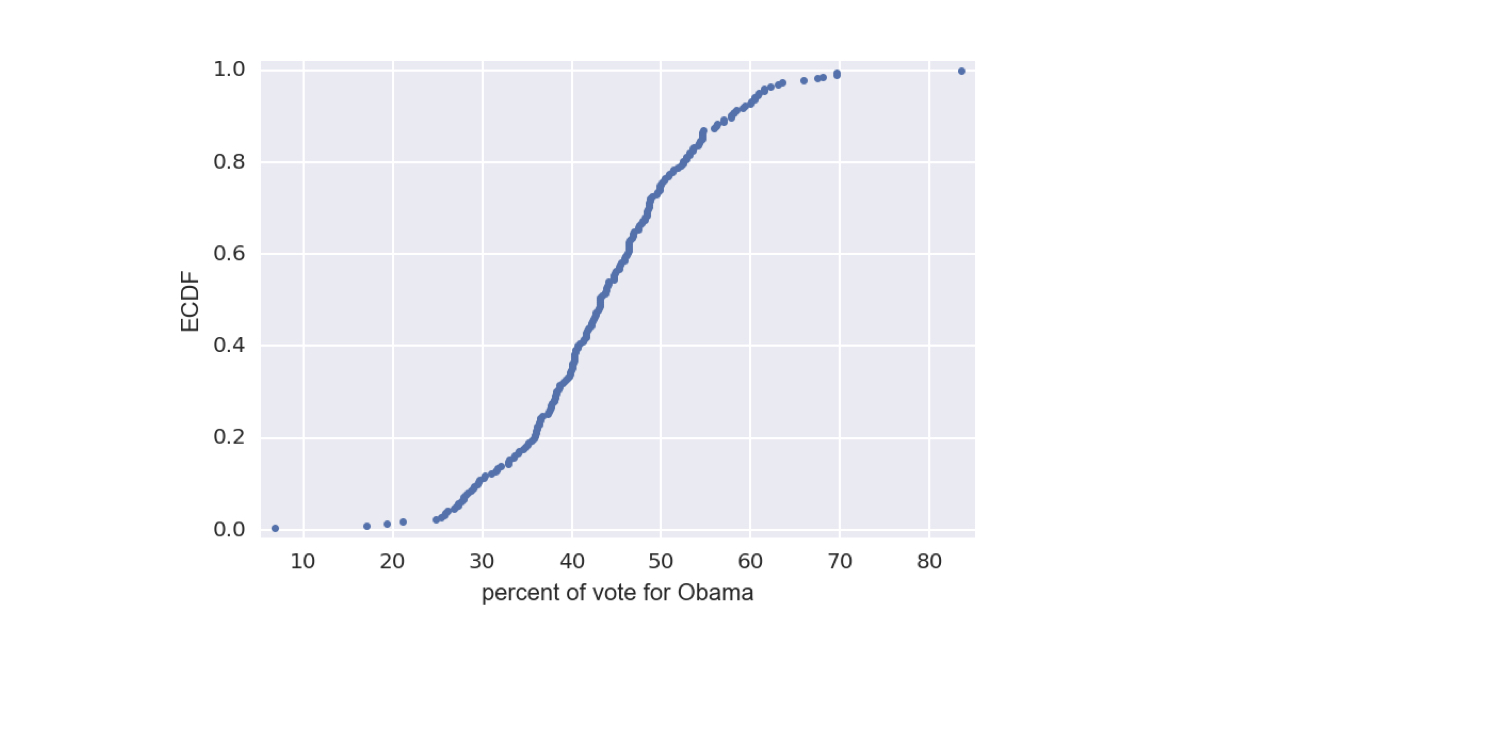
ch2-2_v2.003.png

1 Données obtenues sur Data.gov (https://www.data.gov/)
Réflexion statistique en Python (Partie 1)

Centiles sur une ECDF

ch2-2_v2.004.png

Réflexion statistique en Python (Partie 1)

Centiles sur une ECDF

ch2-2_v2.005.png

Réflexion statistique en Python (Partie 1)

Centiles sur une ECDF

ch2-2_v2.006.png

Réflexion statistique en Python (Partie 1)

Calcul des centiles

np.percentile(df_swing['dem_share'], [25, 50, 75])
array([ 37.3025,  43.185 ,  49.925 ])
Réflexion statistique en Python (Partie 1)

Boîte à moustaches : élection américaine 2008
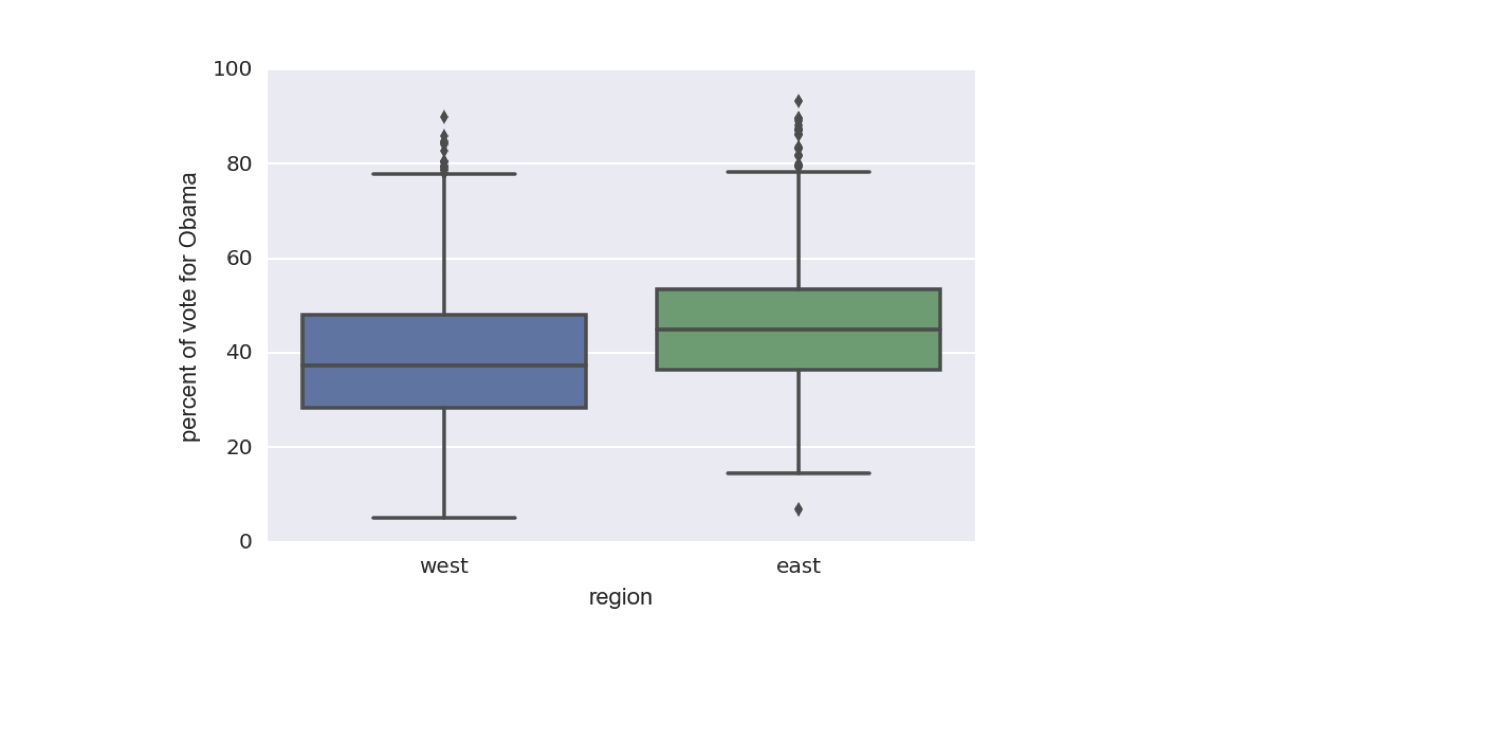
ch2-2_v2.011.png

1 Données obtenues sur Data.gov (https://www.data.gov/)
Réflexion statistique en Python (Partie 1)

Boîte à moustaches : élection américaine 2008
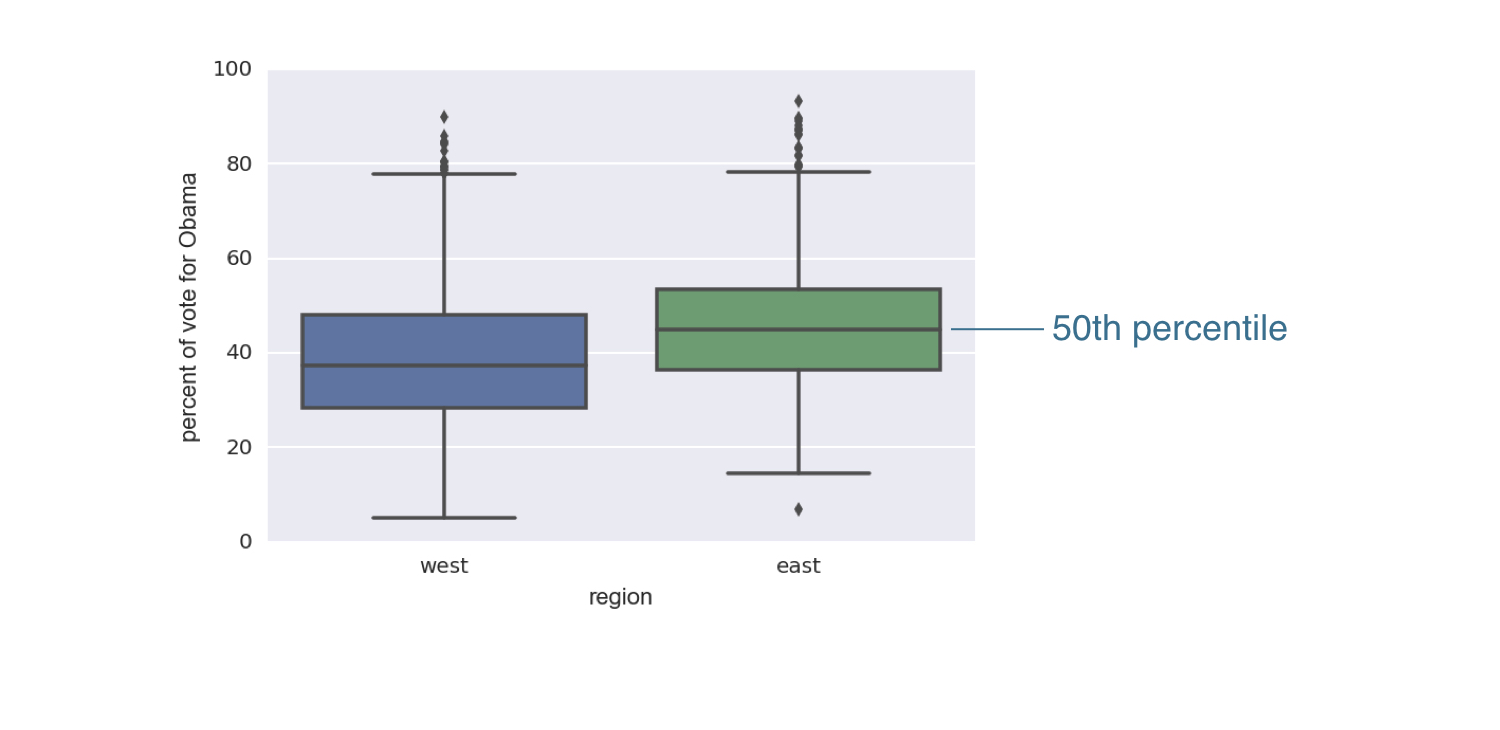
ch2-2_v2.012.png

Réflexion statistique en Python (Partie 1)

Boîte à moustaches : élection américaine 2008
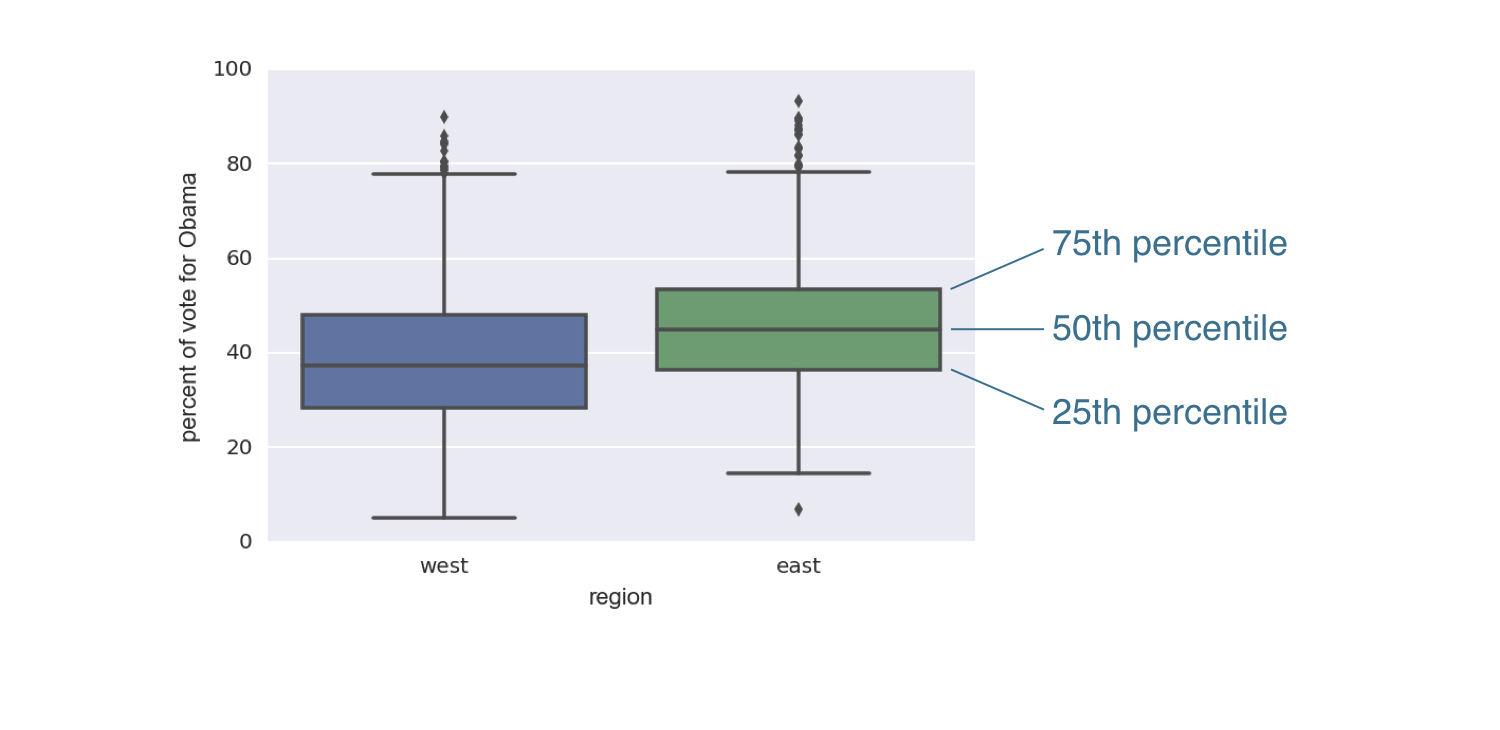
ch2-2_v2.013.png

Réflexion statistique en Python (Partie 1)

Boîte à moustaches : élection américaine 2008
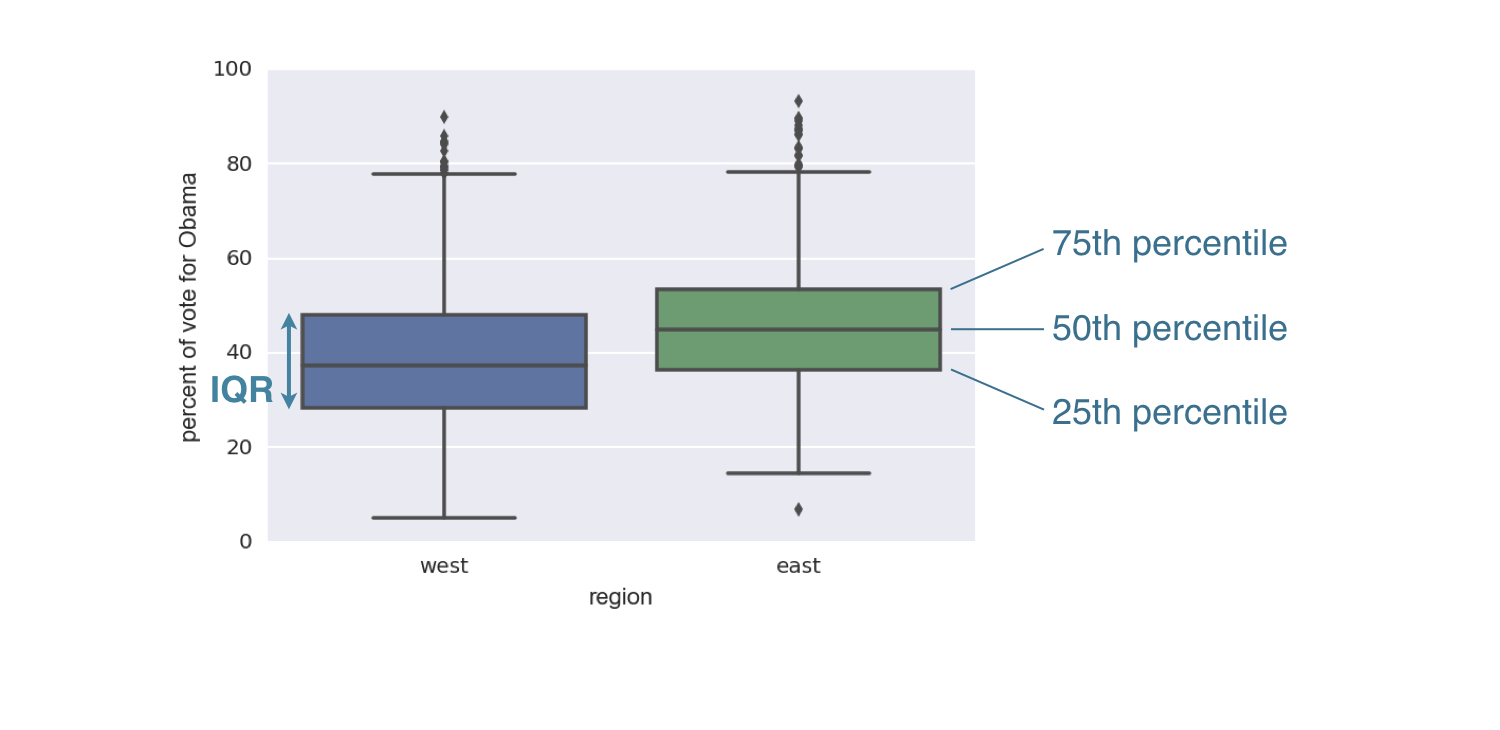
ch2-2_v2.014.png

Réflexion statistique en Python (Partie 1)

Boîte à moustaches : élection américaine 2008
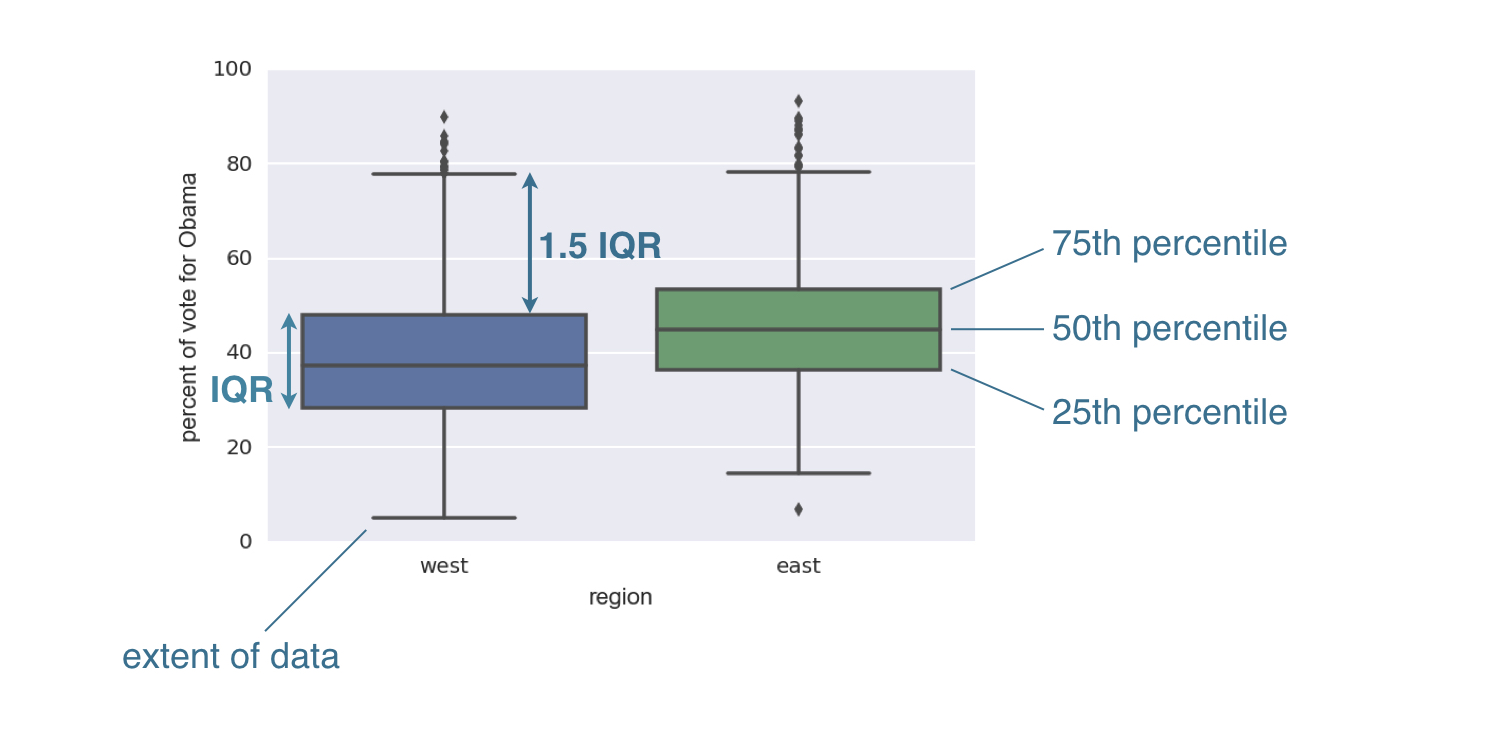
ch2-2_v2.015.png

Réflexion statistique en Python (Partie 1)

Boîte à moustaches : élection américaine 2008
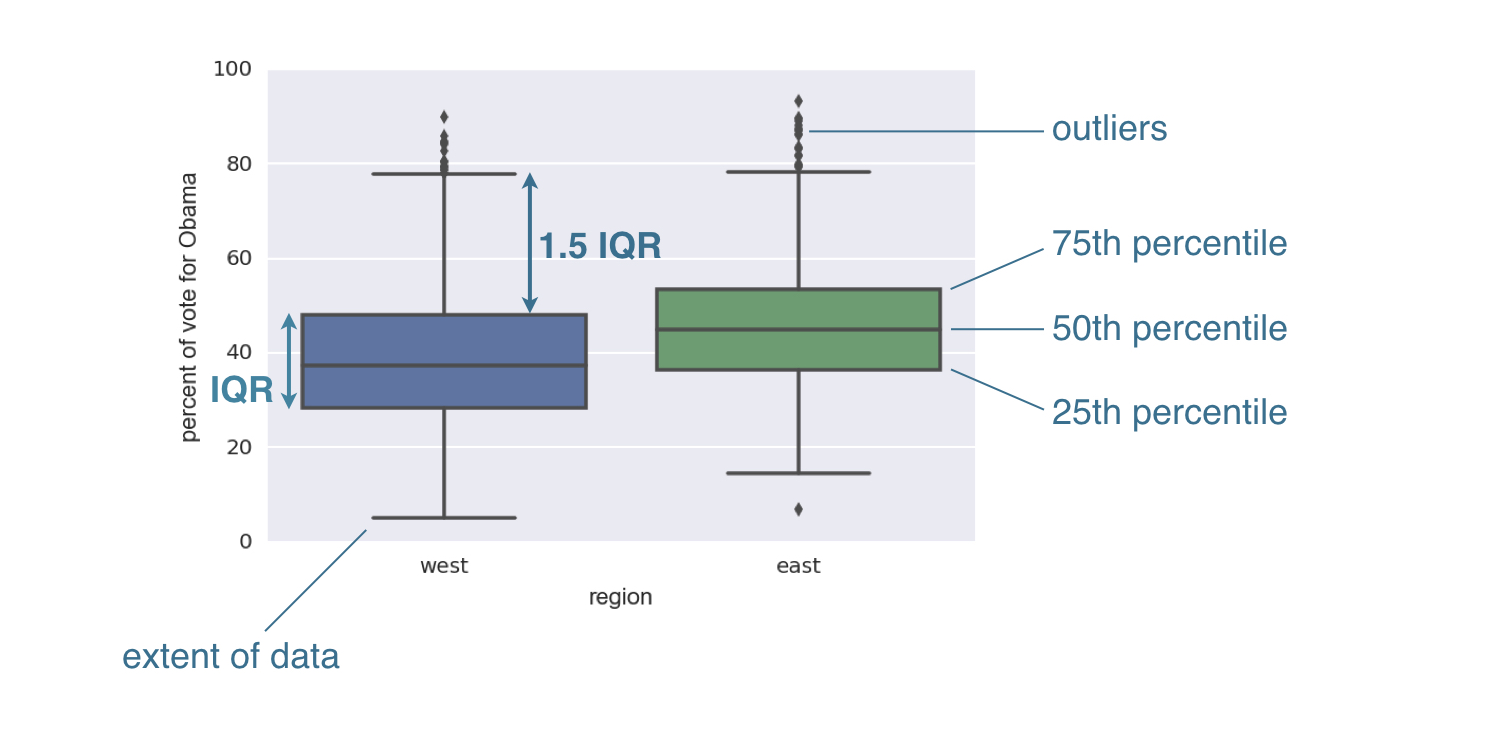
ch2-2_v2.016.png

Réflexion statistique en Python (Partie 1)

Générer une boîte à moustaches

import matplotlib.pyplot as plt
import seaborn as sns
_ = sns.boxplot(x='east_west', y='dem_share',
                    data=df_all_states)
_ = plt.xlabel('region')
_ = plt.ylabel('percent of vote for Obama')
plt.show()
Réflexion statistique en Python (Partie 1)

Passons à la pratique !

Réflexion statistique en Python (Partie 1)

Preparing Video For Download...