Mesurer le risque d'un portefeuille
Introduction à l'analyse de portefeuille en Python

Charlotte Werger
Data Scientist
Risque d'un portefeuille
- Investir comporte des risques : les actifs individuels montent ou descendent
- Le rendement attendu est une variable aléatoire
- La dispersion des rendements autour de la moyenne se mesure par la variance $\sigma^2$, un indicateur courant de volatilité
- $\sigma^2 = \frac{\sum\limits_{i=1}^N (X -\mu)^2}{N}$

Variance
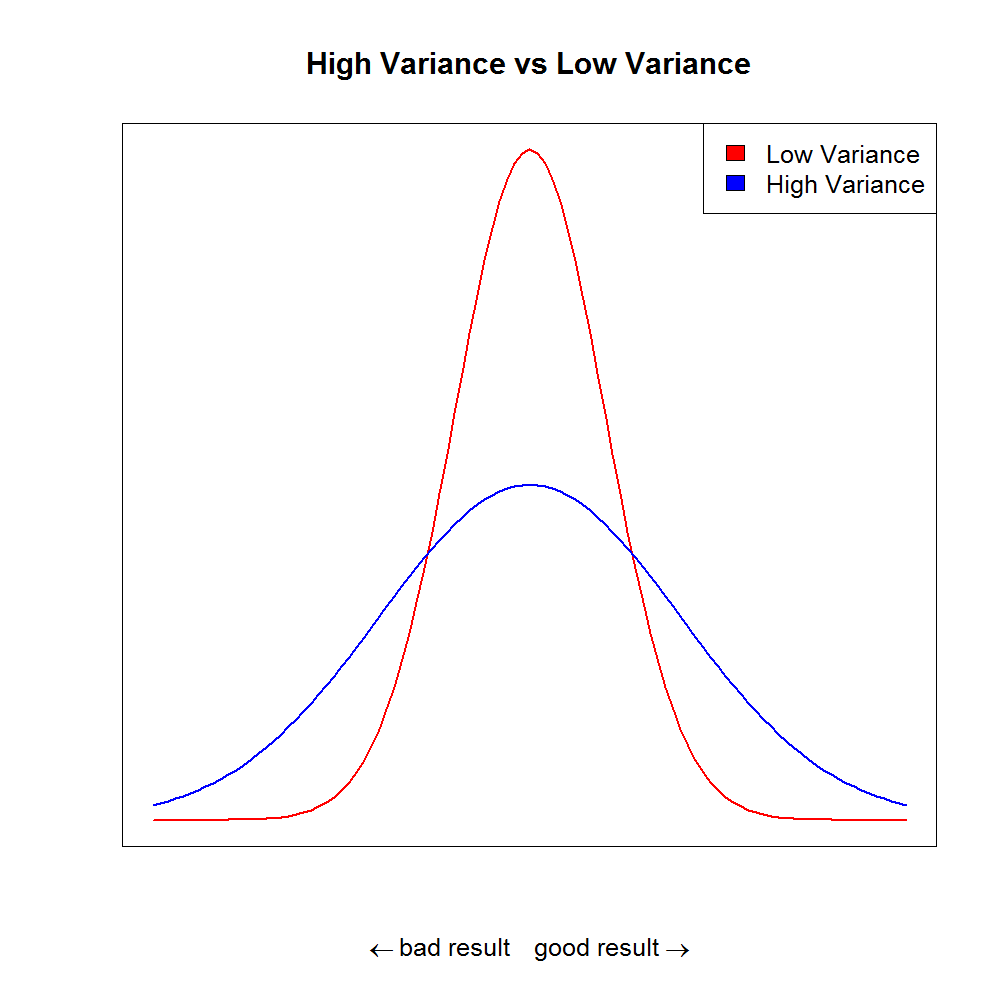
Calculer la variance d'un portefeuille
$$

- $\rho_{1,2} \sigma_1 \sigma_2$ s'appelle la covariance entre les actifs 1 et 2
- La covariance s'écrit aussi $ \sigma_{1,2} $
- Ce qui permet d'écrire :

Réécrire la variance du portefeuille, en plus court

- On peut la réécrire en notation matricielle, plus pratique en code :
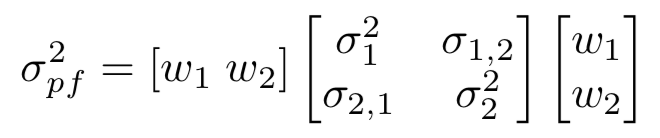
En mots, à calculer en python :
Variance du portefeuille = Poids transposés × (Matrice de covariance × Poids)

