Projections et systèmes de référence de coordonnées

Visualisation de données géospatiales avec Python

Mary van Valkenburg

Data Science Program Manager, Nashville Software School

Projections
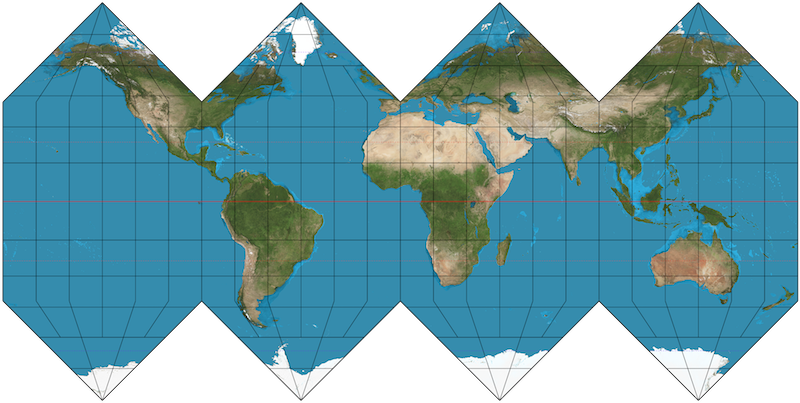
carte aplatie de la Terre sphérique

Visualisation de données géospatiales avec Python

De nombreuses approches de projection cartographique
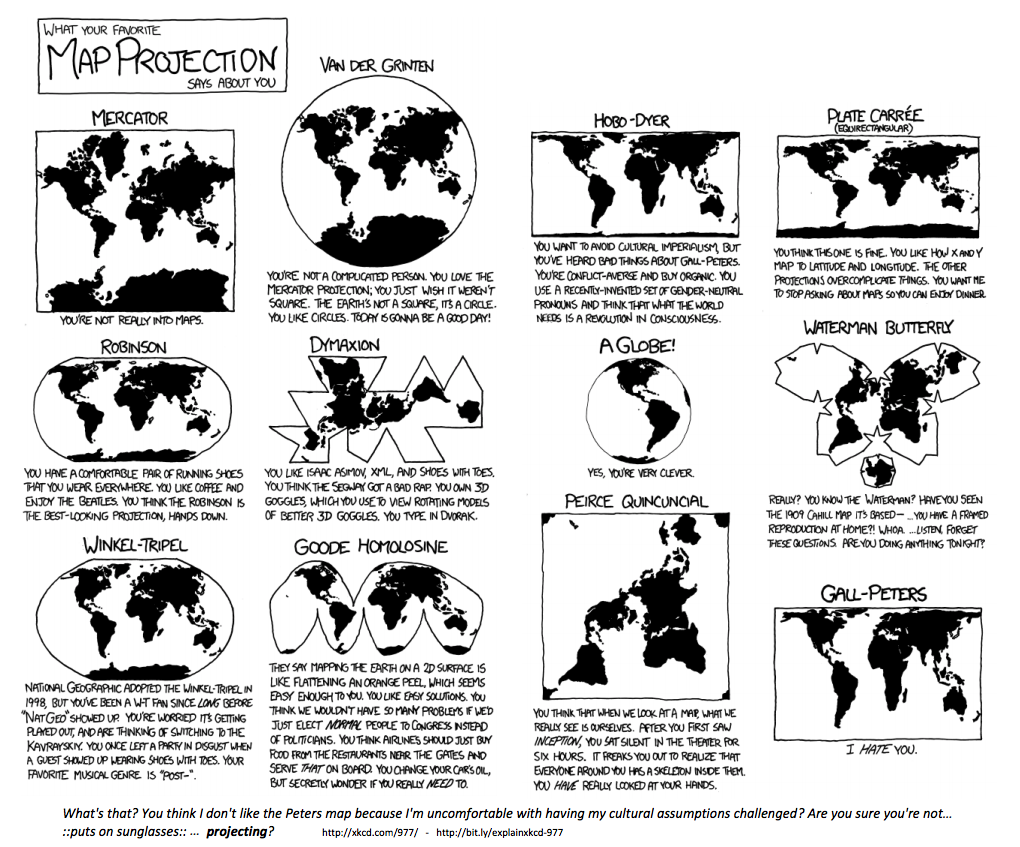
bande dessinée xkcd sur les projections cartographiques

Visualisation de données géospatiales avec Python

Systèmes de référence de coordonnées

EPSG:4326

  • Utilisé par Google Earth
  • Unités : degrés décimaux

EPSG:3857

  • Utilisé par Google Maps, Bing Maps, OpenStreetMap
  • Unités : mètres
Visualisation de données géospatiales avec Python
School Name              Latitude     Longitude
A. Z. Kelley Elementary    36.021       -86.658
Alex Green Elementary      36.252       -86.832
Amqui Elementary           36.273       -86.703
Andrew Jackson Elementary  36.231       -86.623
import geopandas as gpd
schools['geometry'] = gpd.points_from_xy(schools.Longitude, schools.Latitude)
schools.head(4)
School Name                Latitude  Longitude                geometry
A. Z. Kelley Elementary      36.021    -86.658  POINT (-86.658 36.021)
Alex Green Elementary        36.252    -86.832  POINT (-86.832 36.252)
Amqui Elementary             36.273    -86.703  POINT (-86.703 36.273)
Andrew Jackson Elementary    36.231    -86.623  POINT (-86.623 36.231)
Visualisation de données géospatiales avec Python

Créer un GeoDataFrame à partir d’un DataFrame

import geopandas as gpd

schools_geo = gpd.GeoDataFrame(schools, 
                               crs = 'epsg:4326', 
                               geometry = schools.geometry)
schools_geo.head(4)
School Name                Latitude  Longitude               geometry
A. Z. Kelley Elementary      36.021    -86.658  POINT (-86.658 36.021)
Alex Green Elementary        36.252    -86.832  POINT (-86.832 36.252)
Amqui Elementary             36.273    -86.703  POINT (-86.703 36.273)
Andrew Jackson Elementary    36.231    -86.623  POINT (-86.623 36.231)
Visualisation de données géospatiales avec Python

Changer de SRC

schools_geo.head(2)
School Name              Latitude  Longitude                geometry
A. Z. Kelley Elementary    36.021    -86.658  POINT (-86.658 36.021)
Alex Green Elementary      36.252    -86.832  POINT (-86.832 36.252)
schools_geo.geometry = schools_geo.geometry.to_crs(epsg = 3857)
schools_geo.head(2)
School Name              Latitude  Longitude                      geometry
A. Z. Kelley Elementary    36.021    -86.658  POINT (-9646818.8 4303623.8)
Alex Green Elementary      36.252    -86.832  POINT (-9666119.5 4335484.4)
Visualisation de données géospatiales avec Python

Passons à la pratique !

Visualisation de données géospatiales avec Python

Preparing Video For Download...