Paramètres optimaux

Réflexion statistique en Python (partie 2)

Justin Bois

Lecturer at the California Institute of Technology

Histogramme des mesures de Michelson
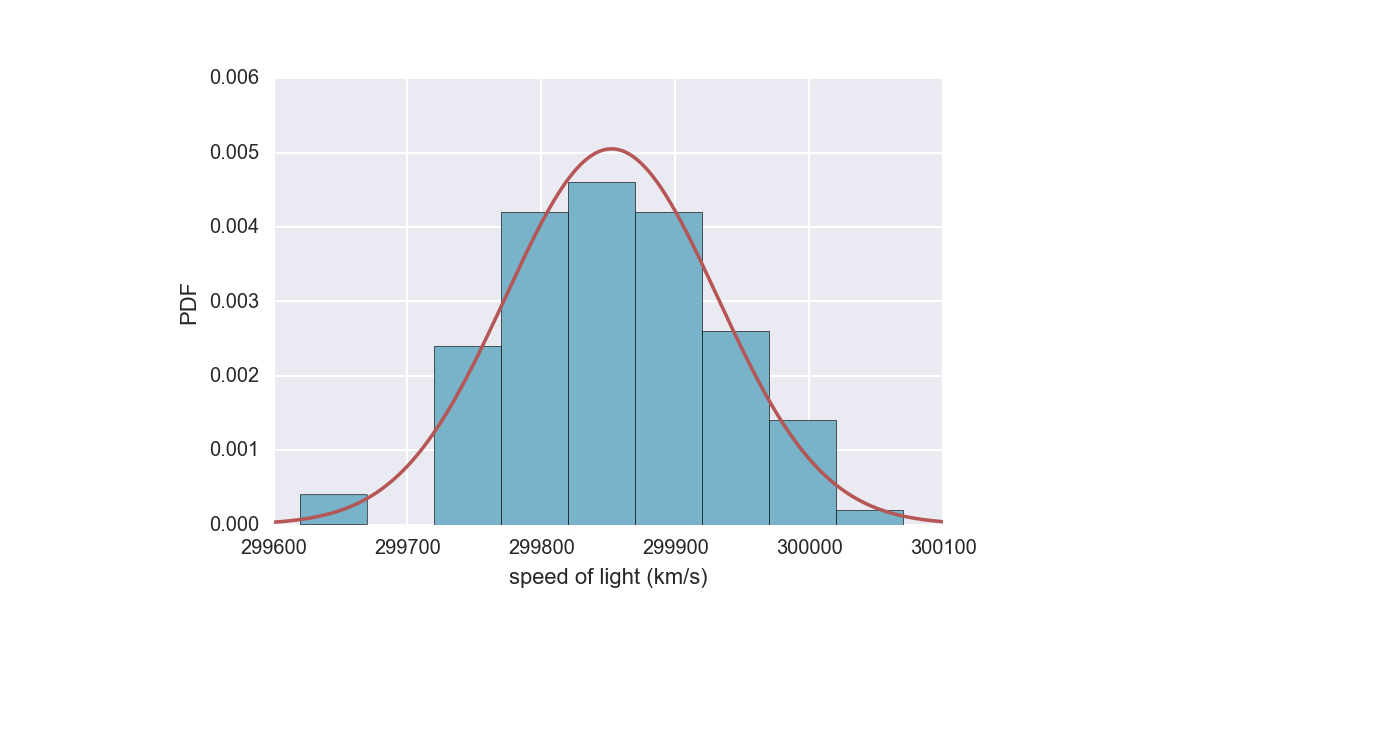
ch1-1.002.png

1 Données : Michelson, 1880
Réflexion statistique en Python (partie 2)

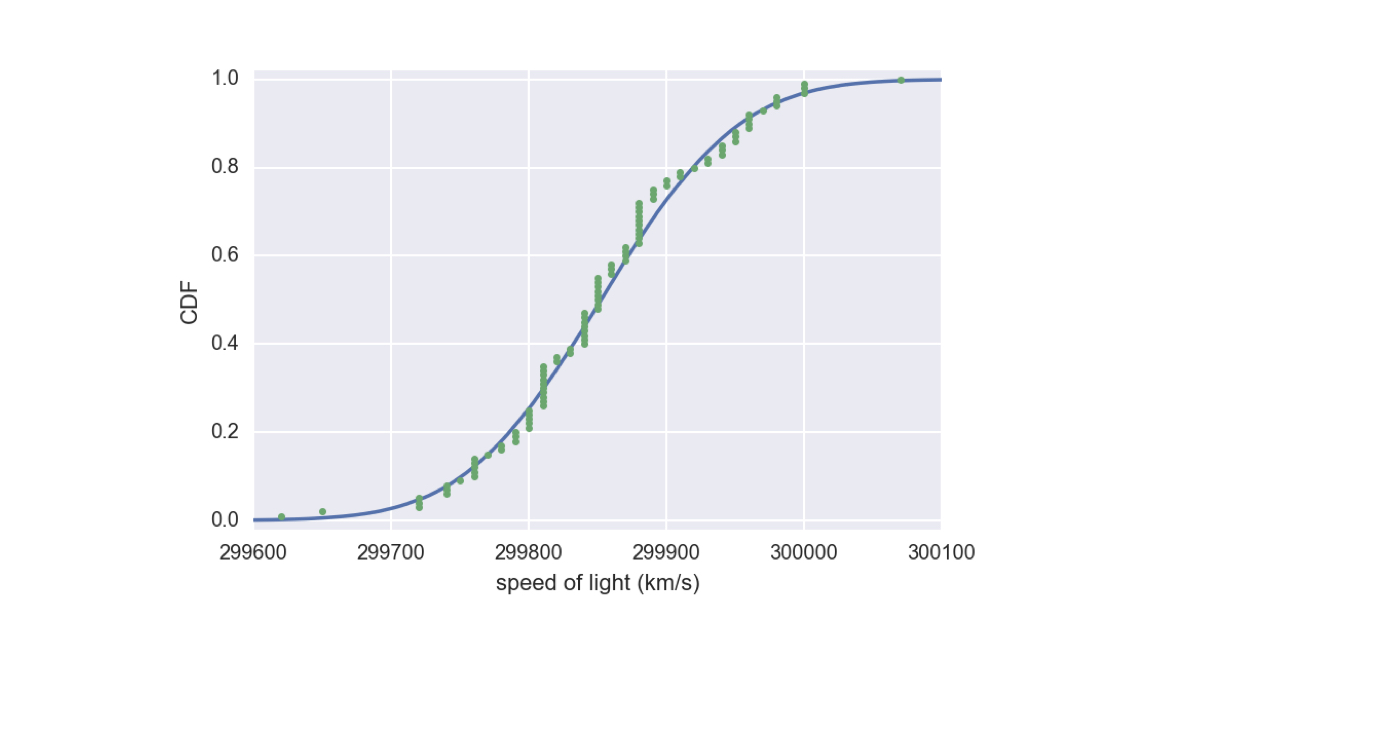
FDC des mesures de Michelson

ch1-1.004.png

1 Données : Michelson, 1880
Réflexion statistique en Python (partie 2)

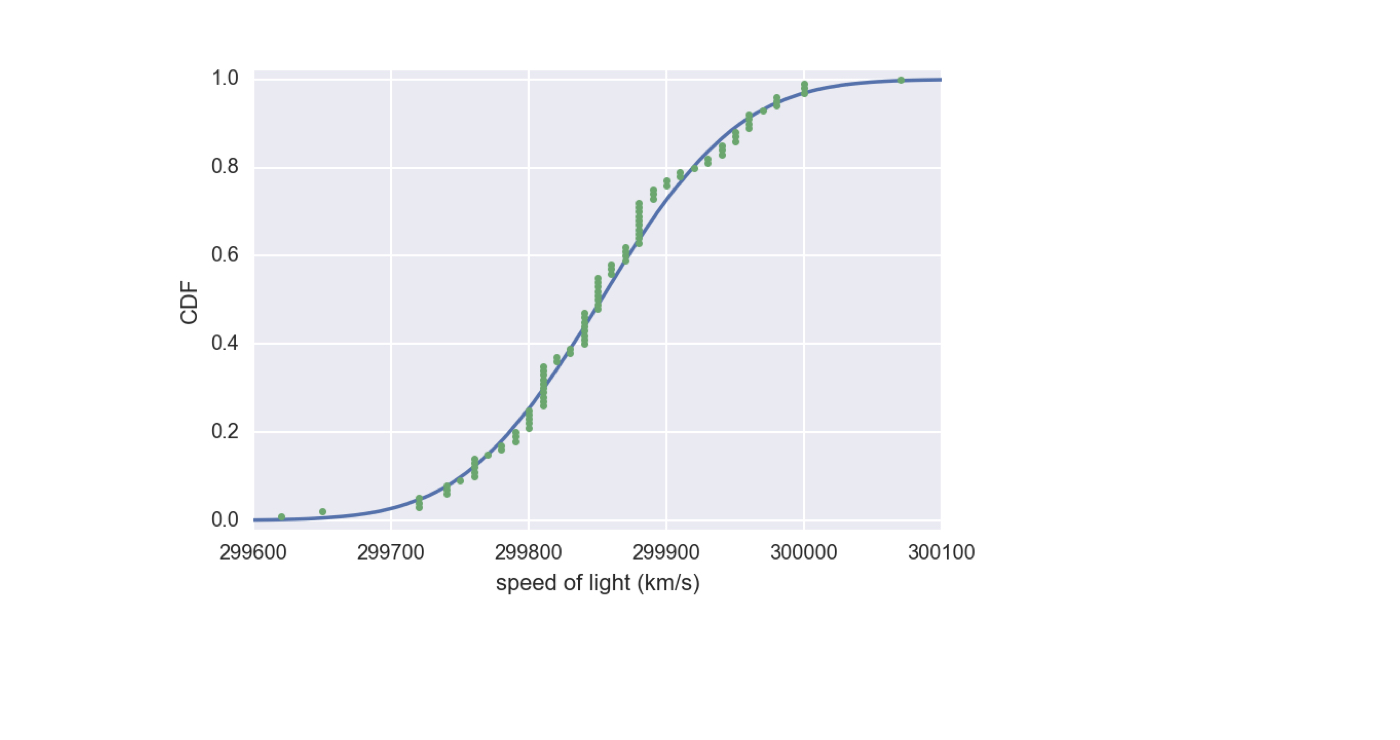
Vérifier la normalité des données de Michelson

import numpy as np
import matplotlib.pyplot as plt

mean = np.mean(michelson_speed_of_light) std = np.std(michelson_speed_of_light) samples = np.random.normal(mean, std, size=10000)
Réflexion statistique en Python (partie 2)

FDC des mesures de Michelson

ch1-1.010.png

1 Données : Michelson, 1880
Réflexion statistique en Python (partie 2)

FDC avec mauvaise estimation de l'écart-type
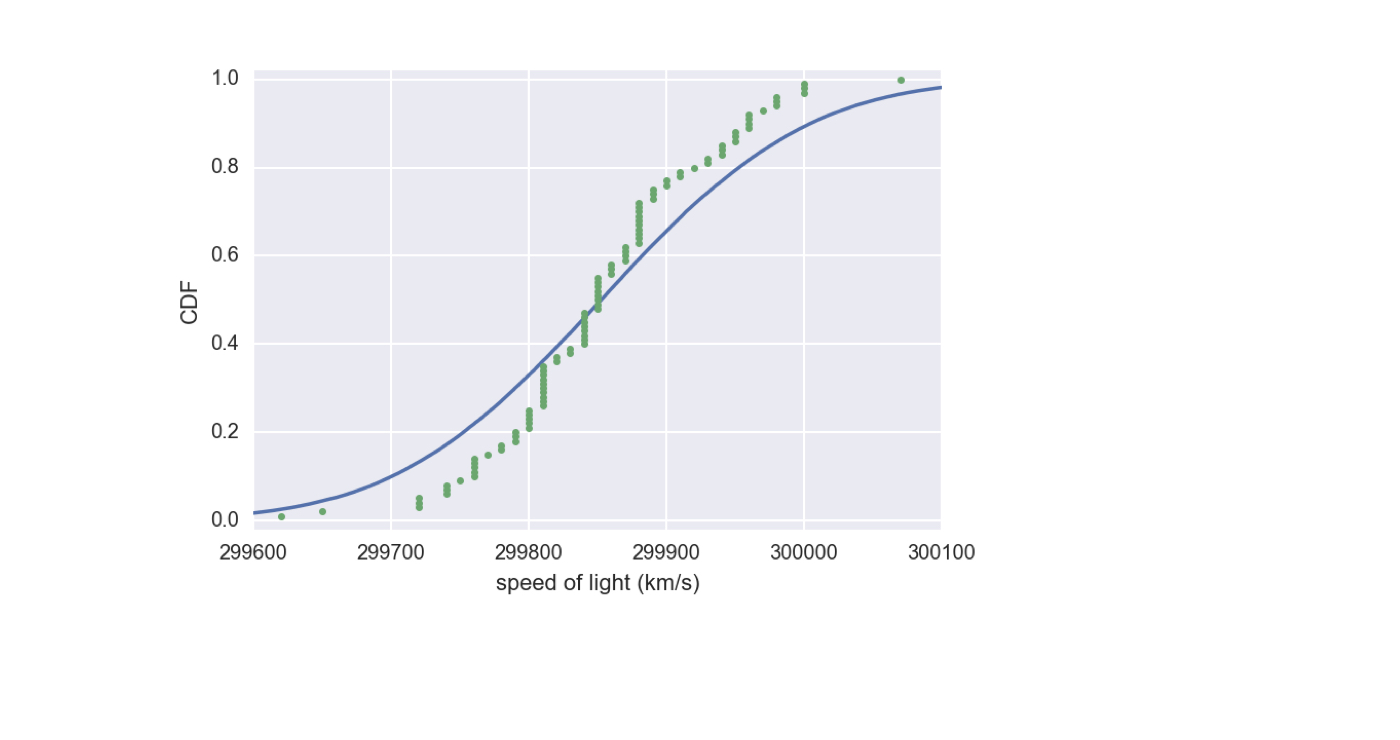
ch1-1.012.png

1 Données : Michelson, 1880
Réflexion statistique en Python (partie 2)

FDC avec mauvaise estimation de la moyenne
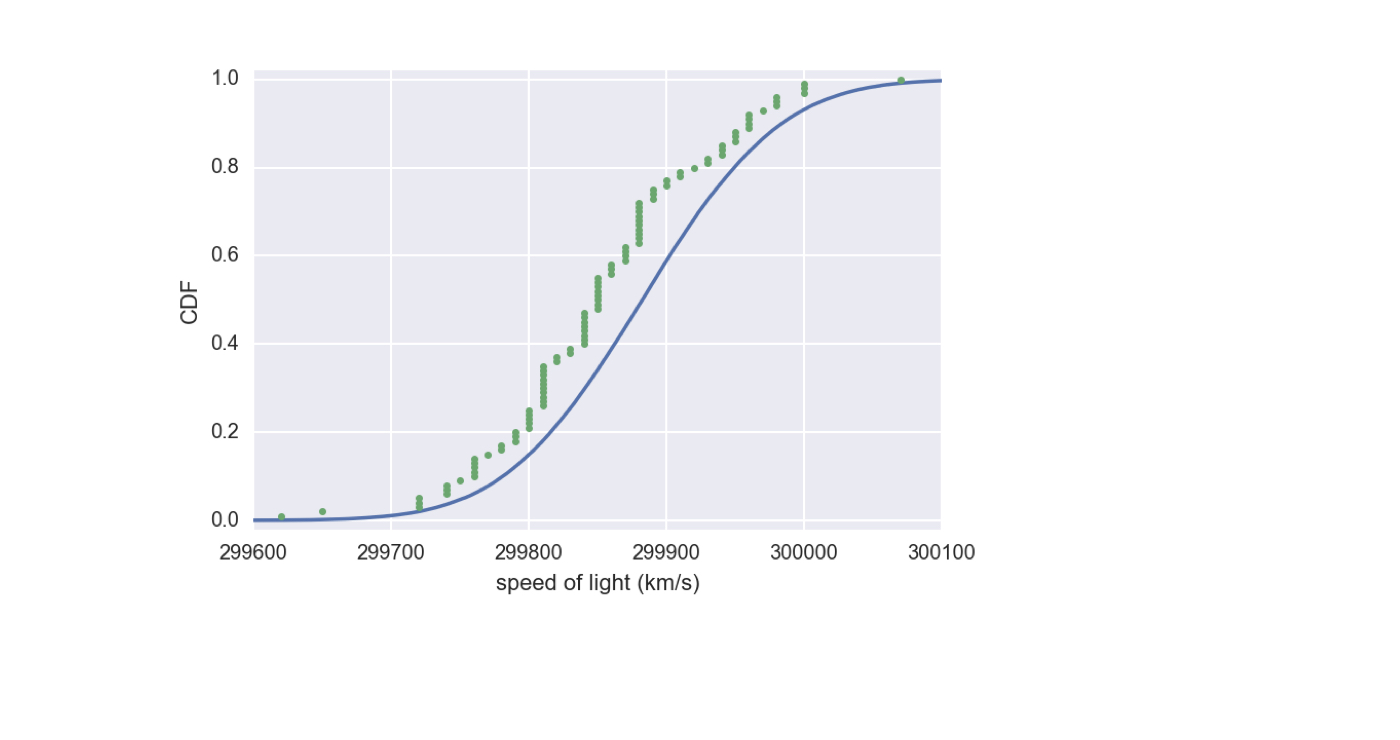
ch1-1.014.png

1 Données : Michelson, 1880
Réflexion statistique en Python (partie 2)

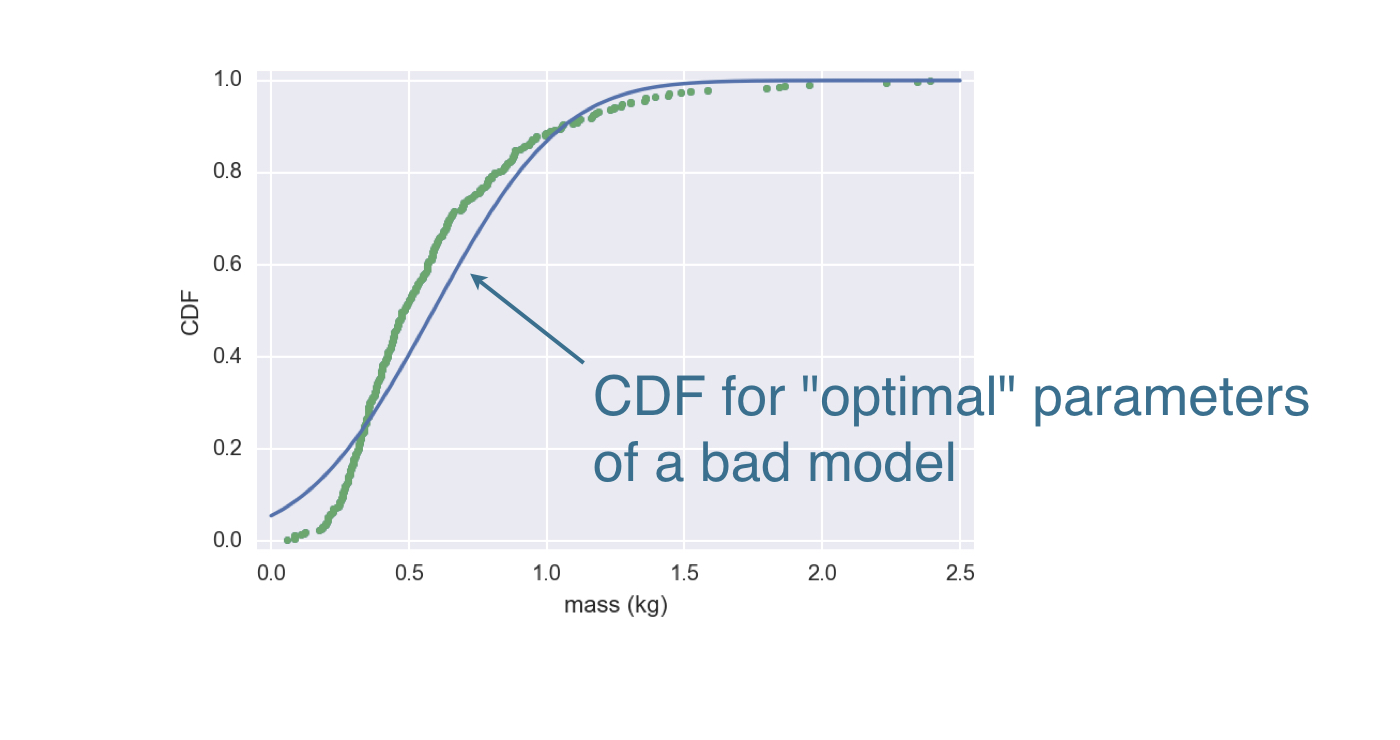
Paramètres optimaux

  • Valeurs de paramètres qui rapprochent au mieux le modèle des données
Réflexion statistique en Python (partie 2)

Masse du bar à grande bouche du MA

ch1-1.017.png

1 Source : Mass. Dept. of Environmental Protection
Réflexion statistique en Python (partie 2)

Progiciels pour l'inférence statistique
ch1-1.020.png

Réflexion statistique en Python (partie 2)

Progiciels pour l'inférence statistique
ch1-1.021.png

Réflexion statistique en Python (partie 2)

Progiciels pour l'inférence statistique
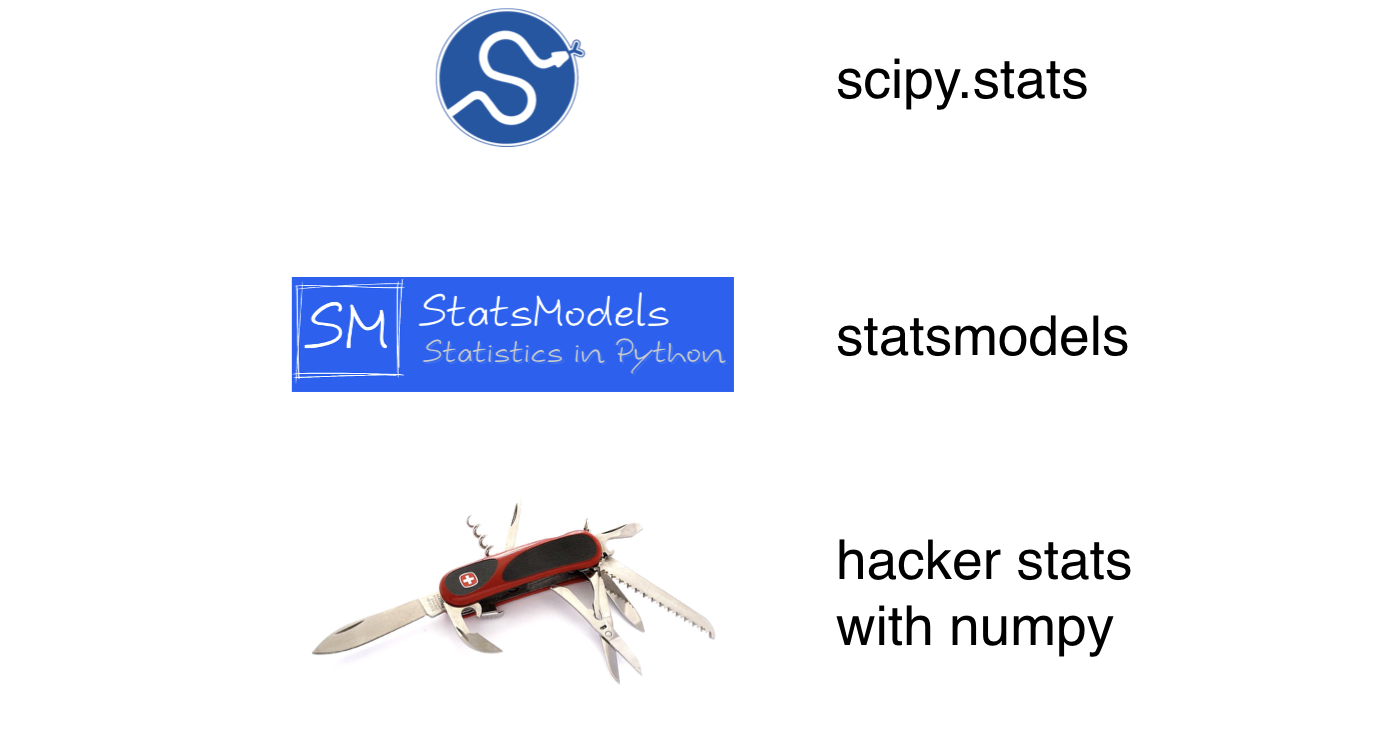
ch1-1.022.png

1 Image du couteau : D-M Commons, CC BY-SA 3.0
Réflexion statistique en Python (partie 2)

Passons à la pratique !

Réflexion statistique en Python (partie 2)

Preparing Video For Download...