Modèles GARCH en Python
Chelsea Yang
Data Science Instructor


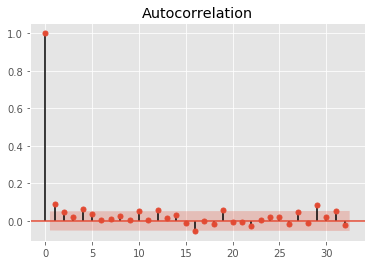
Décrit la corrélation d'une variable avec elle-même selon un décalage temporel
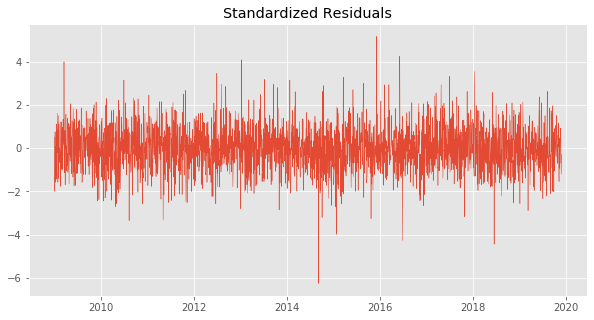
La présence d'autocorrélation dans les résidus normalisés indique que le modèle peut ne pas être valide
Pour détecter l'autocorrélation :

La zone rouge du graphique indique le niveau de confiance (alpha = 5 %)
from statsmodels.graphics.tsaplots import plot_acf
plot_acf(my_data, alpha = 0.05)
# Import the Python module
from statsmodels.stats.diagnostic import acorr_ljungbox
# Perform the Ljung-Box test
lb_test = acorr_ljungbox(std_resid , lags = 10)
# Check p-values
print('P-values are: ', lb_test[1])
Modèles GARCH en Python