Analytique marketing : prédire l'attrition de la clientèle avec Python
Mark Peterson
Director of Data Science, Infoblox
La bibliothèque seaborn permet de créer facilement des graphiques clairs et attrayants
Repose sur matplotlib
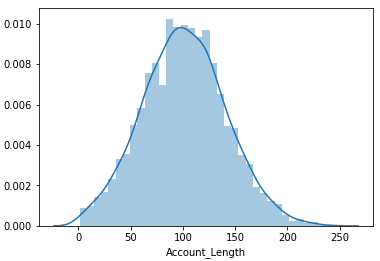
import matplotlib.pyplot as plt import seaborn as snssns.distplot(telco['Account_Length'])plt.show()

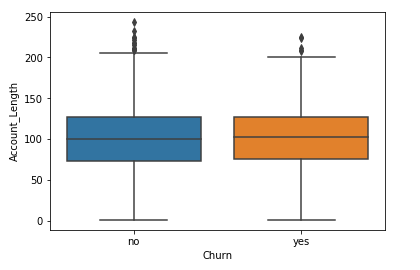
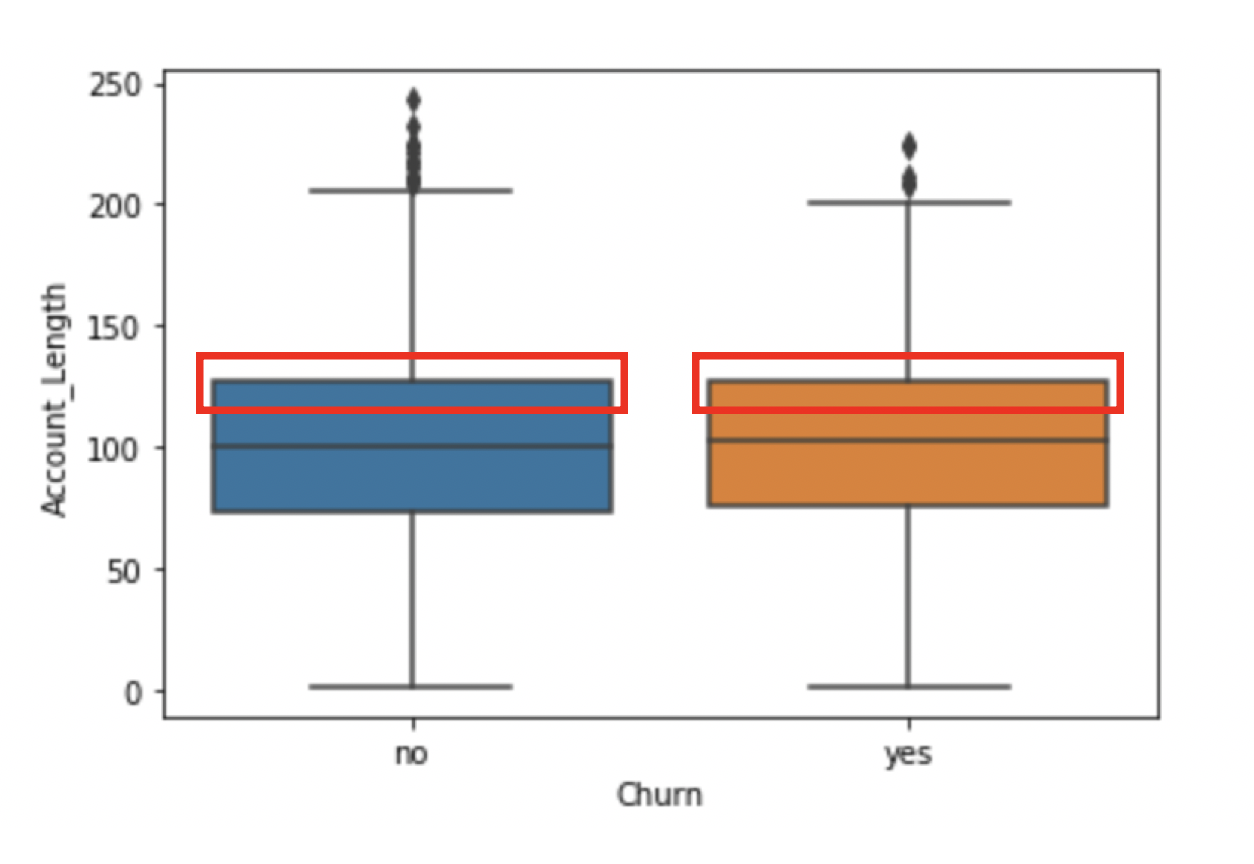
sns.boxplot(x = 'Churn',
y = 'Account_Length',
data = telco)
plt.show()

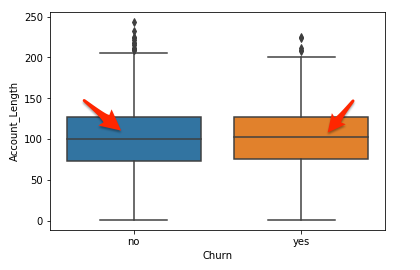
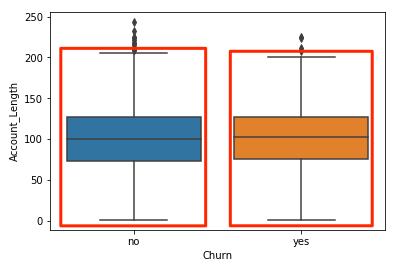
sns.boxplot(x = 'Churn',
y = 'Account_Length',
data = telco)
plt.show()

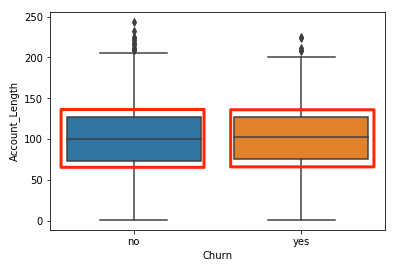
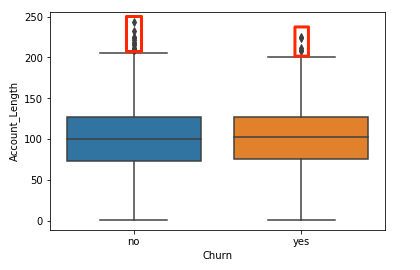
sns.boxplot(x = 'Churn',
y = 'Account_Length',
data = telco)
plt.show()

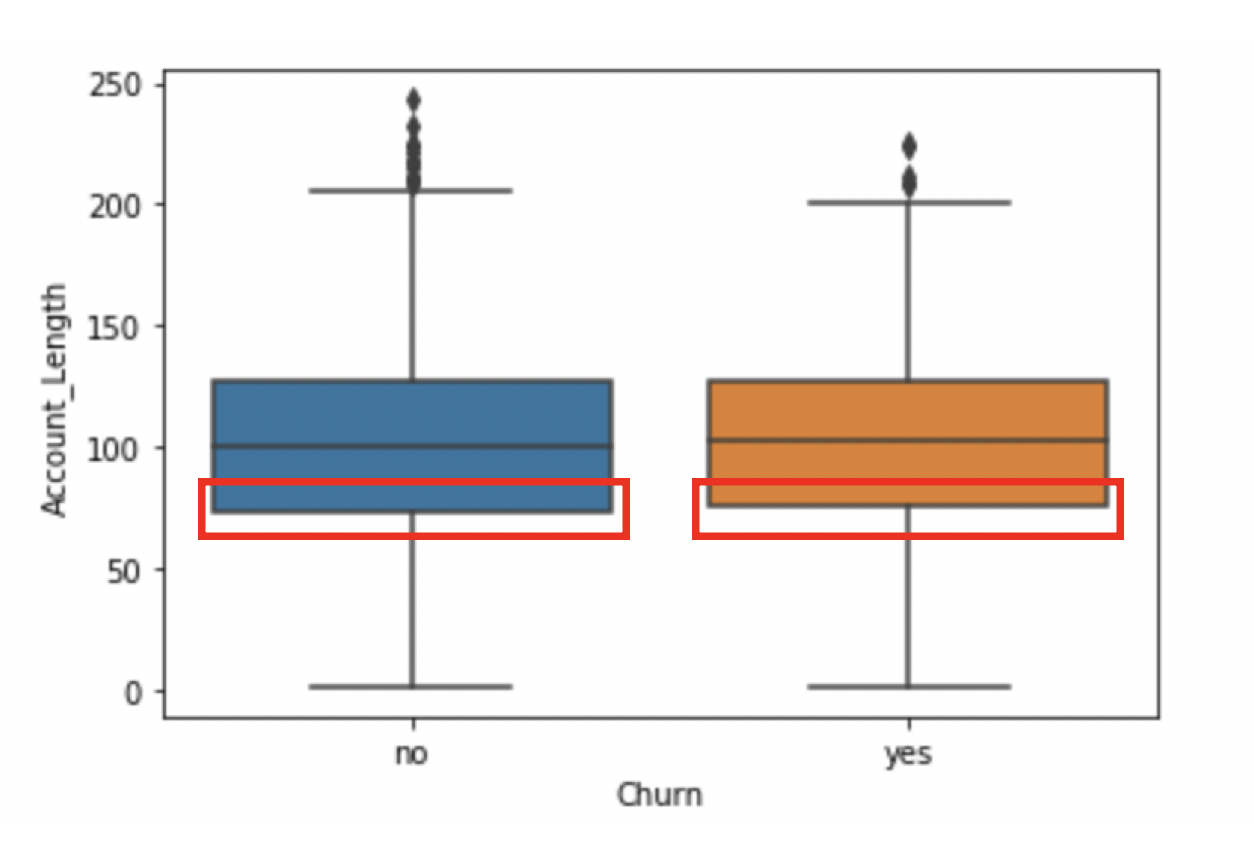
sns.boxplot(x = 'Churn',
y = 'Account_Length',
data = telco)
plt.show()

sns.boxplot(x = 'Churn',
y = 'Account_Length',
data = telco)
plt.show()

sns.boxplot(x = 'Churn',
y = 'Account_Length',
data = telco)
plt.show()

sns.boxplot(x = 'Churn',
y = 'Account_Length',
data = telco)
plt.show()

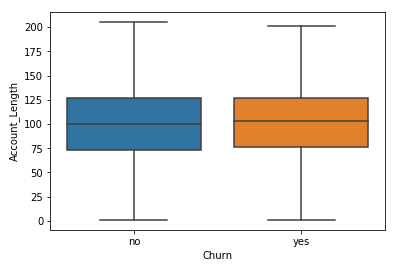
sns.boxplot(x = 'Churn',
y = 'Account_Length',
data = telco,
sym="")
plt.show()

sns.boxplot(x = 'Churn',
y = 'Account_Length',
data = telco,
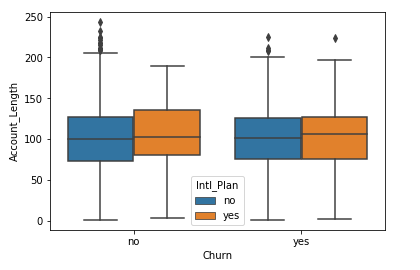
hue = 'Intl_Plan')
plt.show()

Analytique marketing : prédire l'attrition de la clientèle avec Python