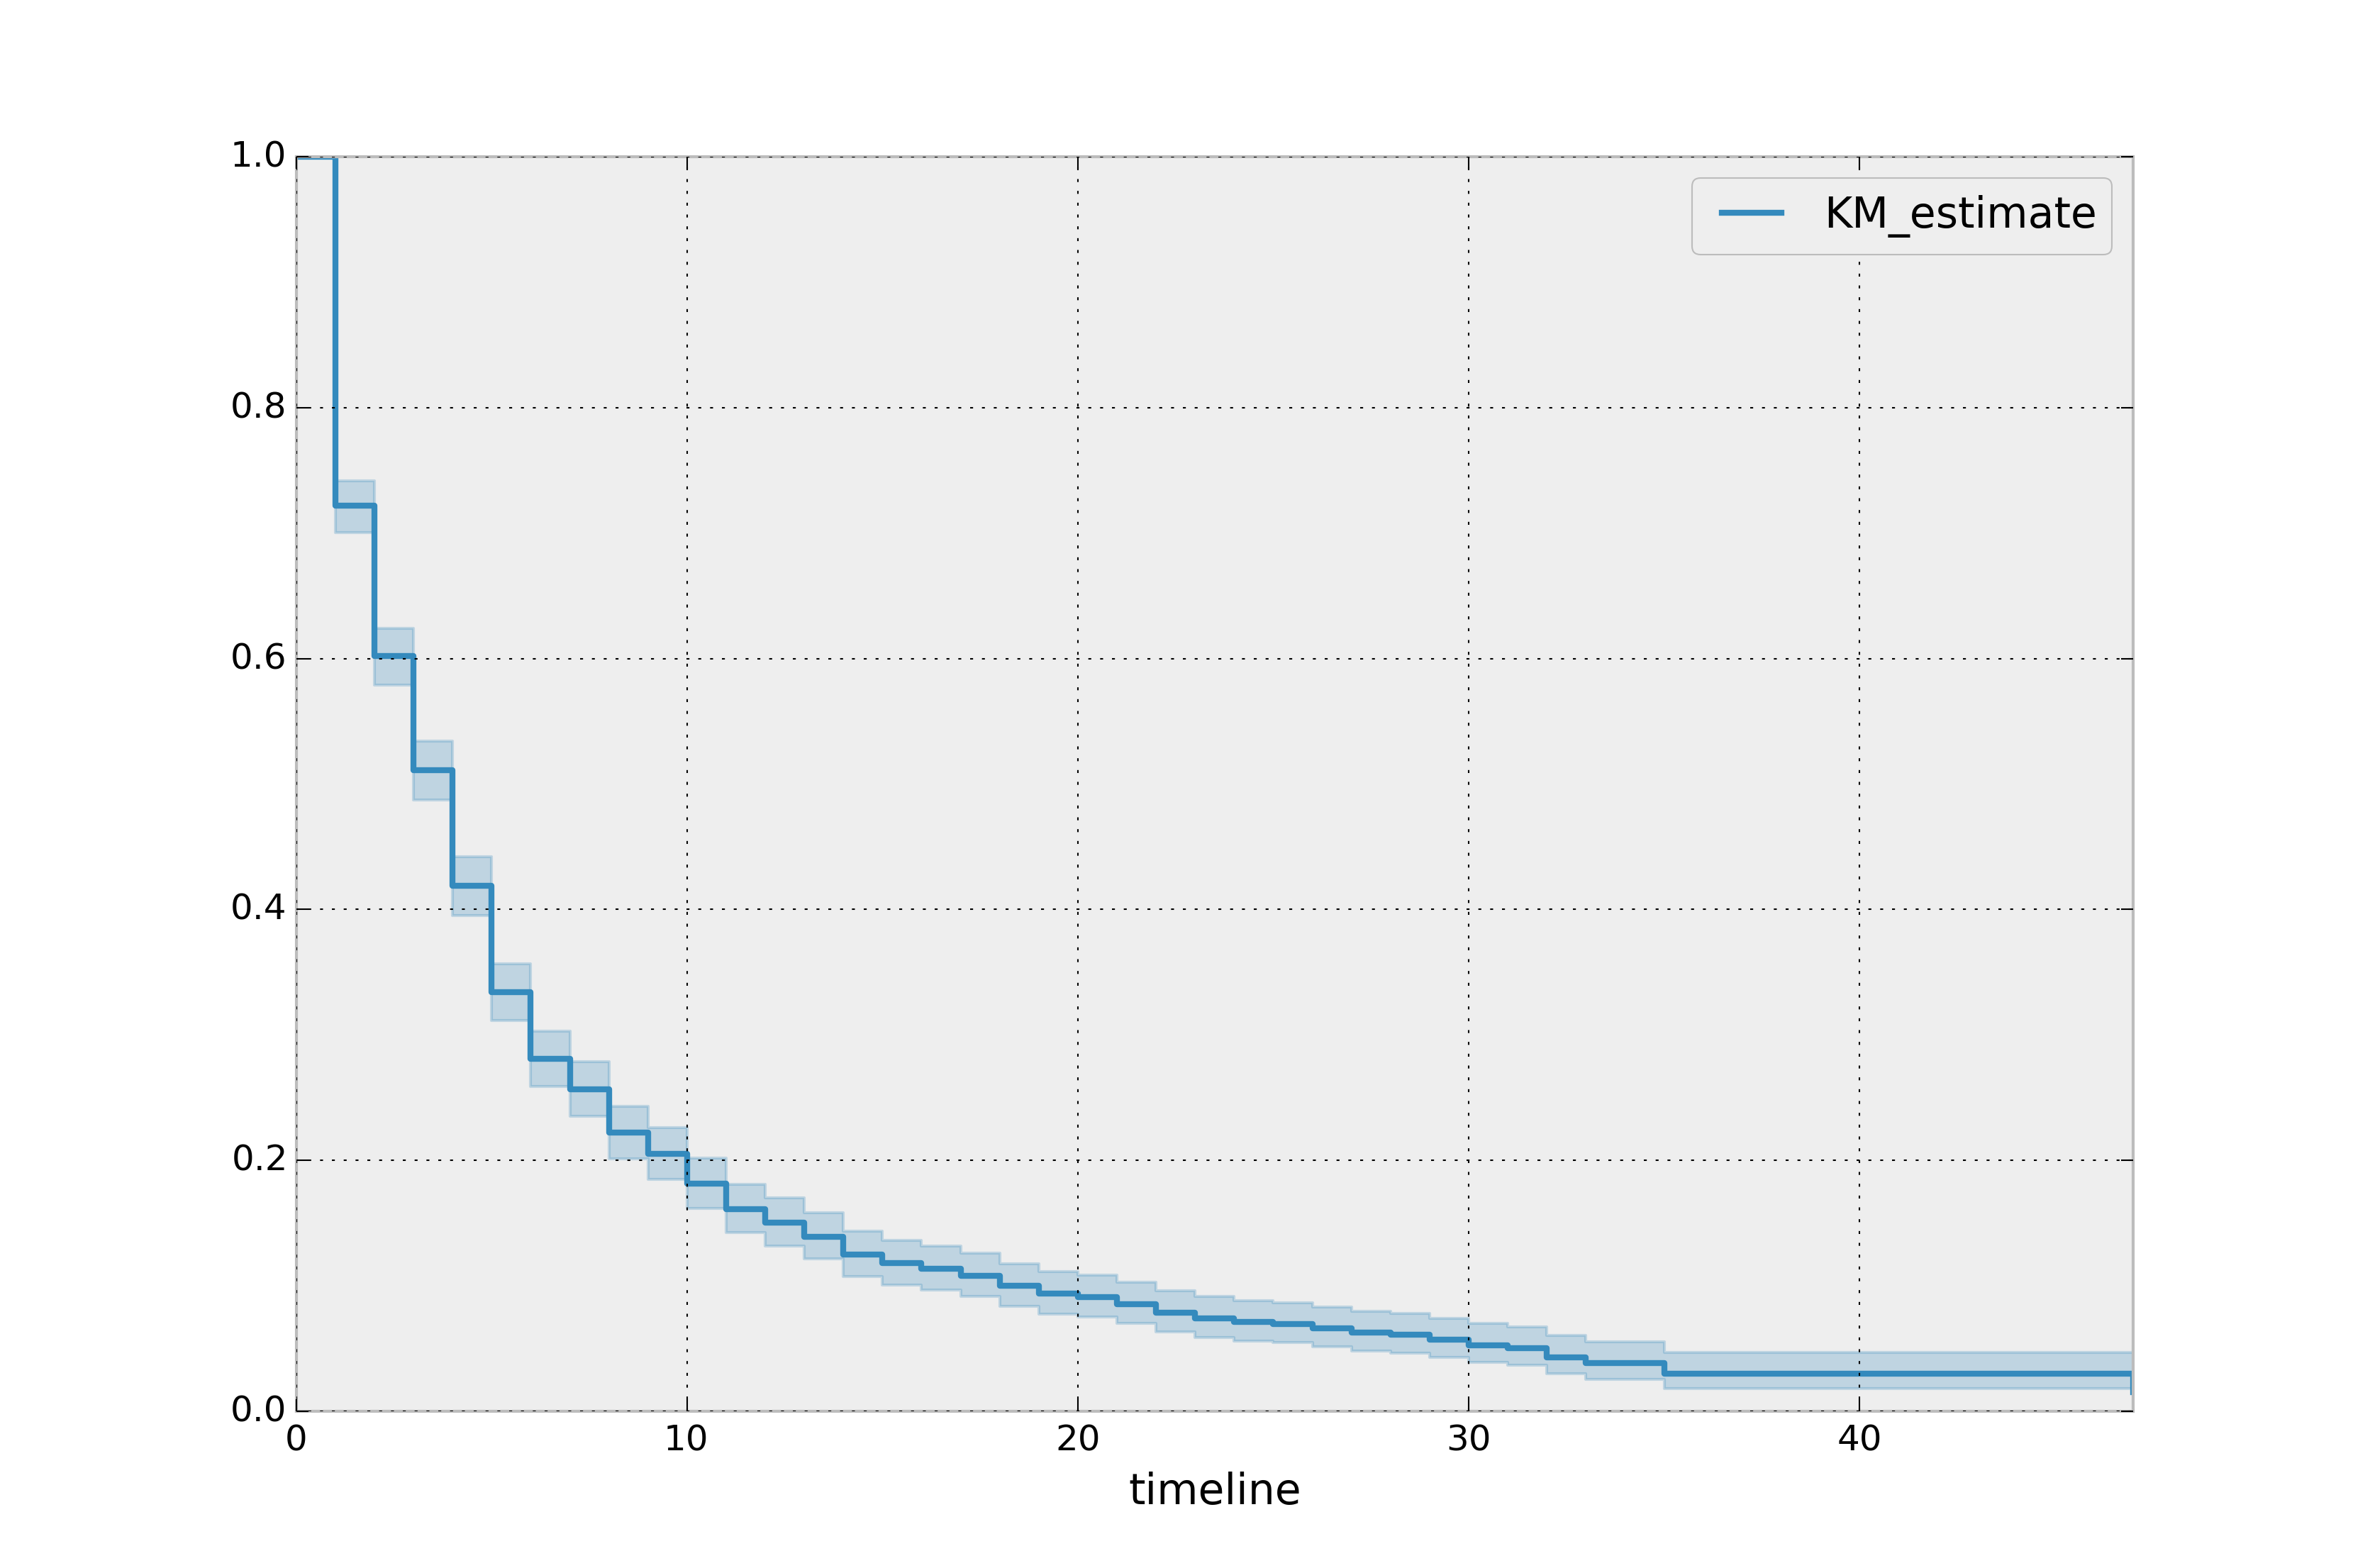
Votre première courbe de survie !
Analyse de survie en Python

Shae Wang
Senior Data Scientist
La courbe de survie
$$\Large{S(t) = Pr(T>t)}$$
La courbe de survie
$$\Large{S(t) = Pr(T>t)}$$
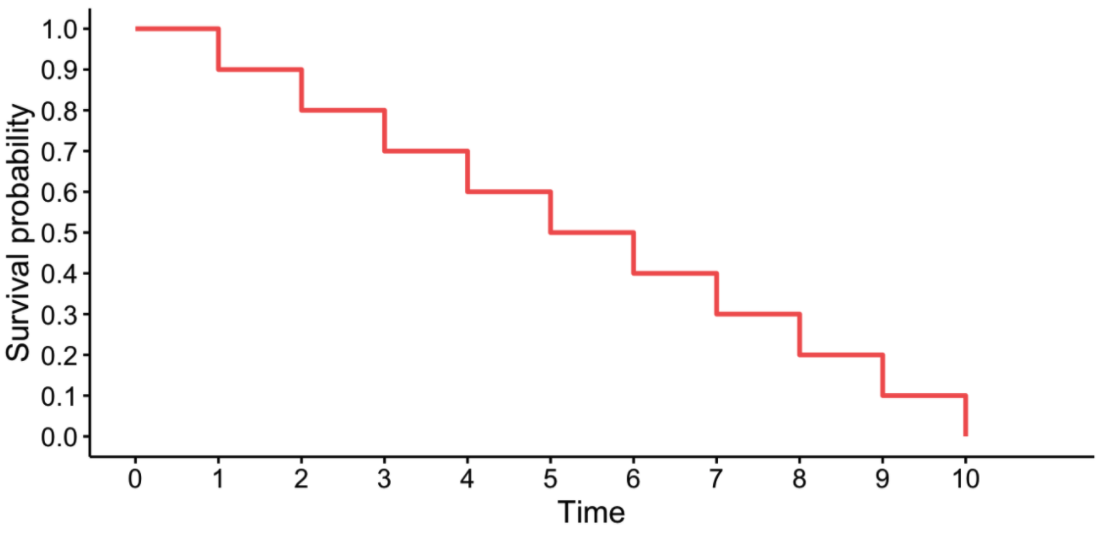
La courbe de survie
$$\Large{S(t) = Pr(T>t)}$$
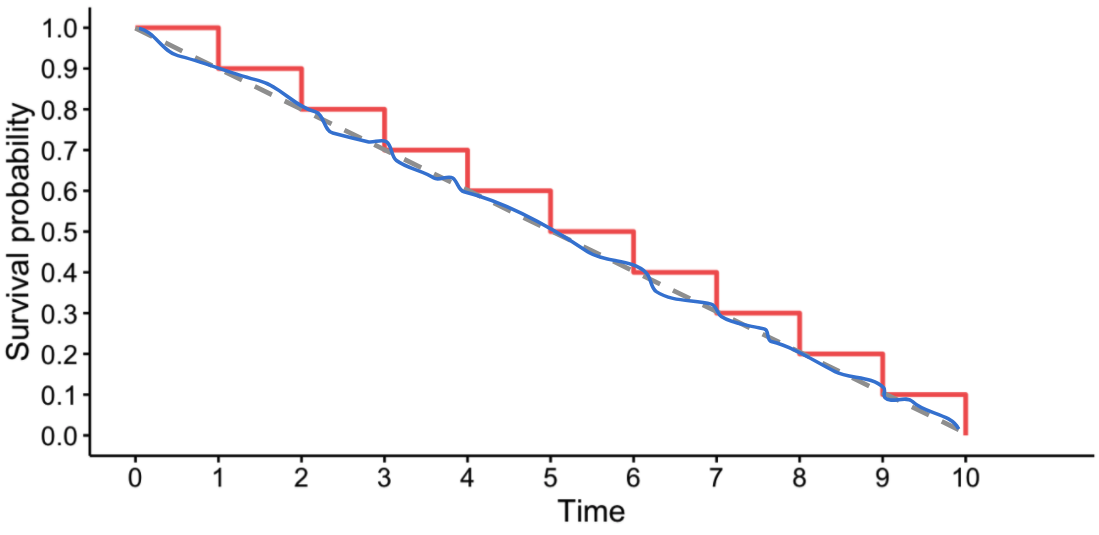
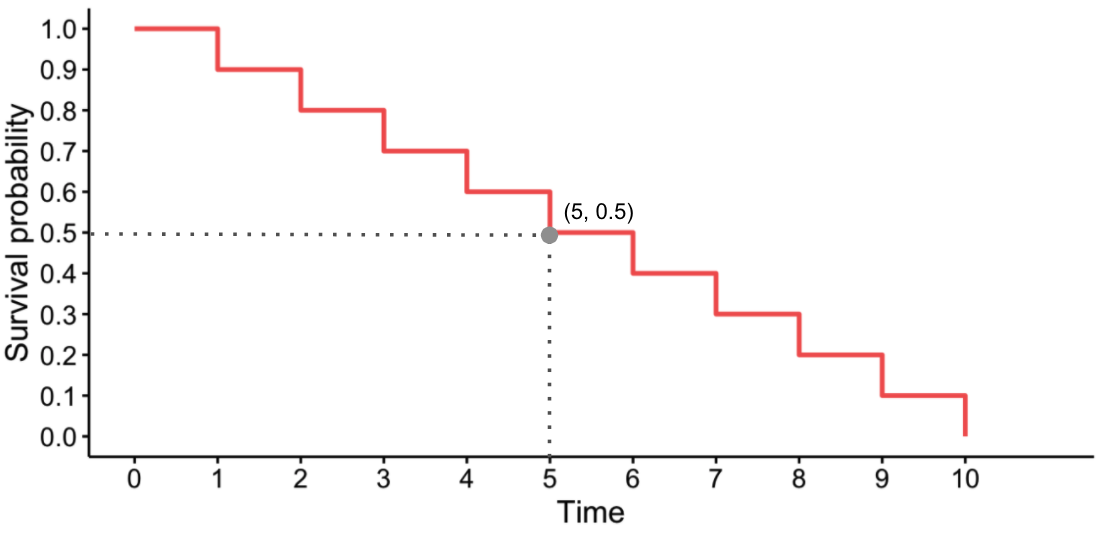
Interpréter une courbe de survie
Interpréter une courbe de survie
Modèles non paramétriques vs paramétriques
Modélisation non paramétrique
- La courbe de survie n'est généralement pas lisse
Modélisation paramétrique
- La courbe de survie est généralement lisse
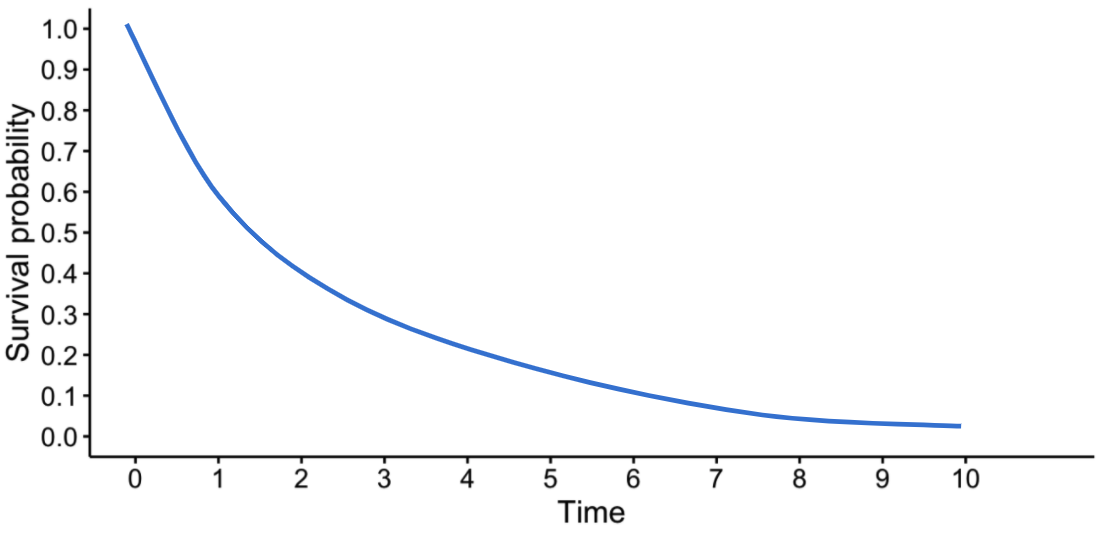
- Suppose que le modèle paramétrique décrit réellement bien les données
Exemple de courbe de survie