Statuts, couleurs et habillages
Créer des tableaux de bord avec shinydashboard

Png Kee Seng
Researcher
Embellir un restaurant

1 Image par Freepik
Statuts dans shinydashboard
- Certains objets shinydashboard ont une propriété
status - Vous pouvez la définir avec l'argument
status<object>(status = <status>, ...)

Statuts dans notificationItem
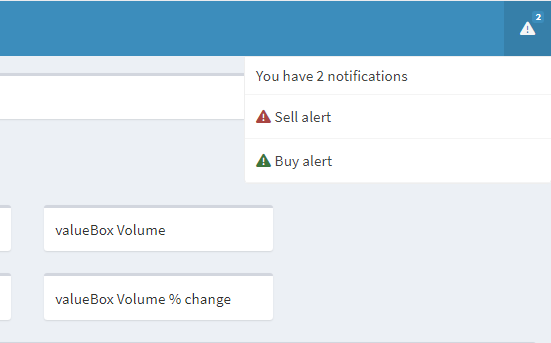
- Ajoutons deux avis dans l'en-tête
- Définir l'alerte d'achat comme message de réussite
- Définir l'alerte de vente comme message de danger
- Le statut par défaut de
notificationItem()est"success"
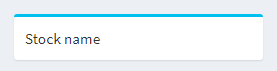
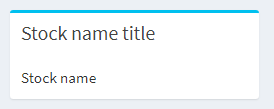
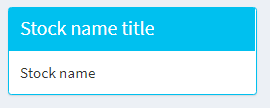
Statuts dans les boîtes
Ajouter de la couleur à shinydashboard
- Dans certains objets shinydashboard, on peut définir
color - Supposons que le prix
closea baissé de 2 % depuis hier- Rendre
valueBox()en rouge pour avertir Sally
- Rendre

Plus de couleurs
- Couleurs offertes dans shinydashboard :
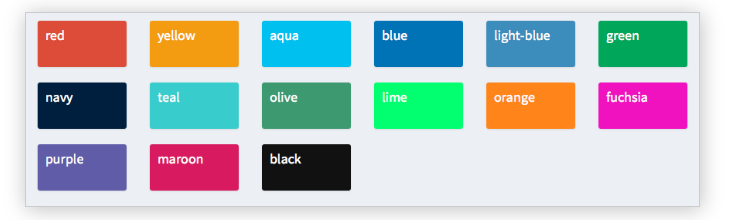
- Consultez les statuts et couleurs disponibles avec
?validStatuseset?validColors
Essayer différents habillages


