R pour les utilisateurs et utilisatrices de SAS
Melinda Higgins, PhD
Research Professor/Senior Biostatistician Emory University

ggplot2 est un puissant module graphique pour Rggplot signifie « grammar of graphics »ggplot2 construit les graphiques par couches# Create plot for x=sex and y=diameter
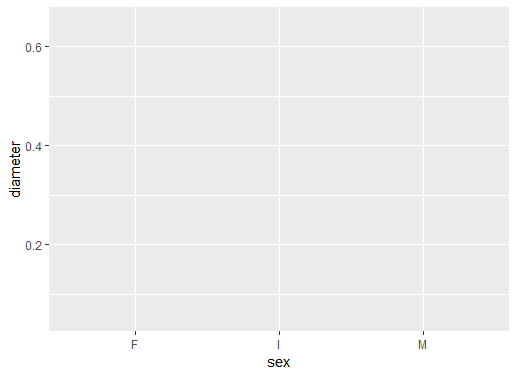
ggplot(data = abalone, aes(sex, diameter))
ggplot()data = abaloneDéfinir aes à sex et diameter
Aucun objet graphique pour l'instant
sexdiameter
# Add boxplot geometric object or geom
ggplot(data = abalone,
aes(sex, diameter)) +
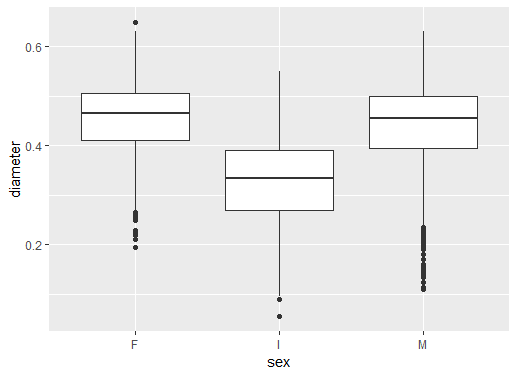
geom_boxplot()
+ ajoute une coucheAjout du diagramme en boîtes geom_boxplot()
Résultat : une série de boîtes
F femelles, I juvéniles et M mâles
# Add black white theme
ggplot(data = abalone,
aes(sex, diameter)) +
geom_boxplot() +
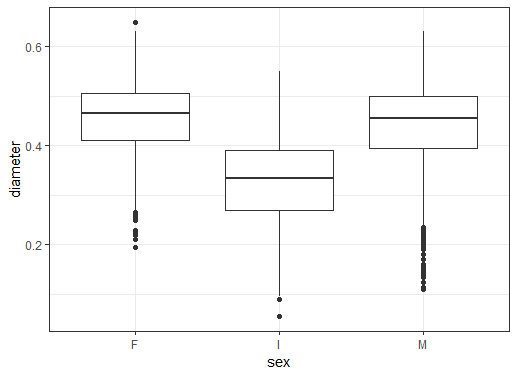
theme_bw()
theme_bw()
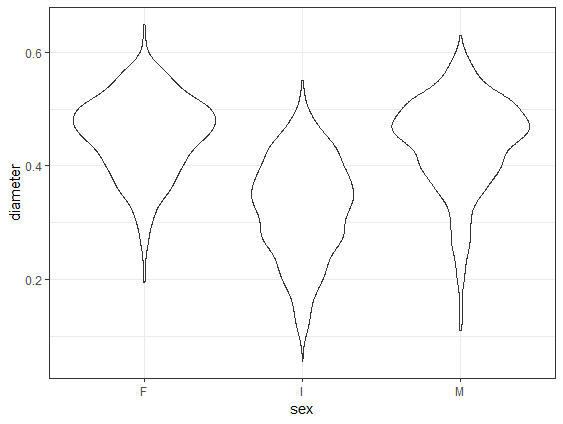
# Change to geom_violin()
ggplot(data = abalone,
aes(sex, diameter)) +
geom_violin() +
theme_bw()
geom_violin remplace geom_boxplot
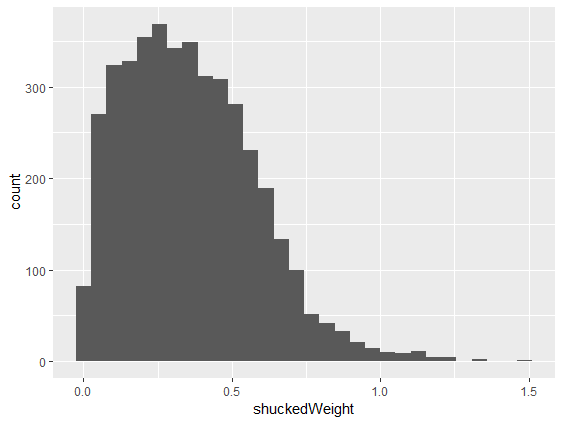
# Make histogram of shuckedWeight
ggplot(abalone, aes(shuckedWeight)) +
geom_histogram()
geom_histogram()aes() à shuckedWeight
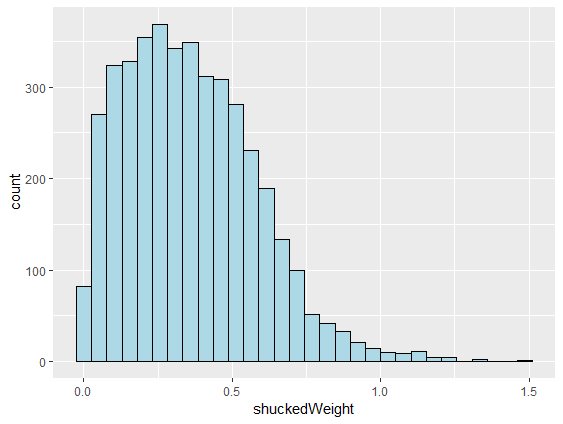
# Make lines black and fill light blue
ggplot(abalone, aes(shuckedWeight)) +
geom_histogram(color = "black",
fill = "lightblue")
color des contoursfill des barres()
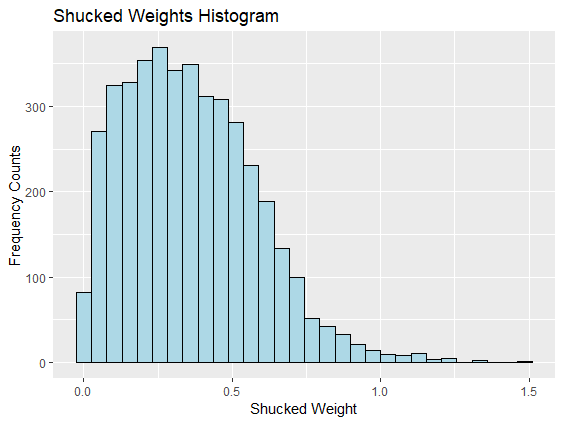
# Add x, y axis labels and title
ggplot(abalone, aes(shuckedWeight)) +
geom_histogram(color = "black",
fill = "lightblue") +
xlab("Shucked Weight") +
ylab("Frequency Counts") +
ggtitle("Shucked Weights Histogram")
xlab() et ylab() pour les axesggtitle() pour le titre
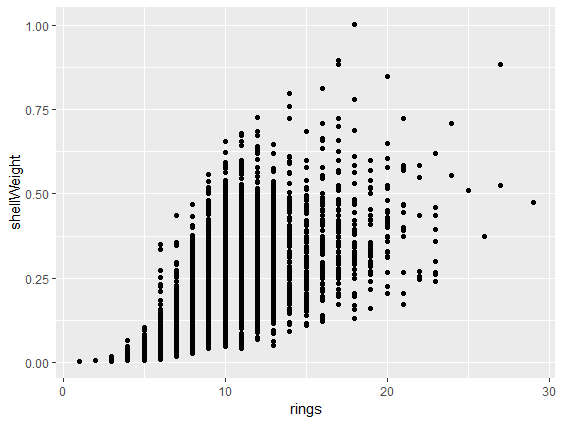
# Make scatterplot with geom_point()
ggplot(abalone,
aes(rings, shellWeight)) +
geom_point()
aes requiert deux variablesgeom_point() ajoute les points
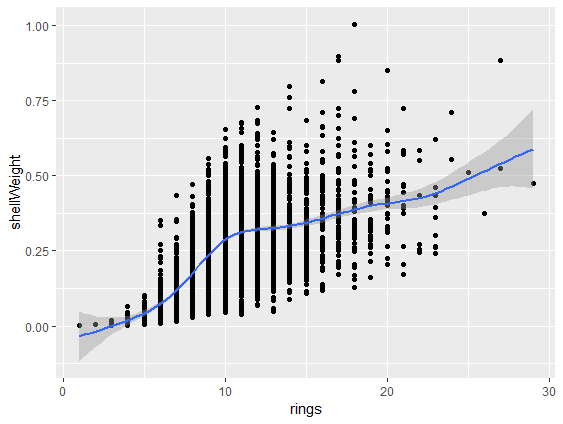
# Add smoothed fit line
ggplot(abalone,
aes(rings, shellWeight)) +
geom_point() +
geom_smooth()
geom_smooth() au nuage de points
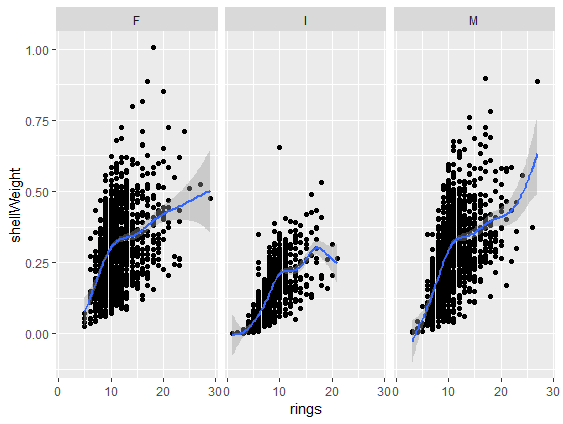
# Add panels using facet_wrap()
ggplot(abalone,
aes(rings, shellWeight)) +
geom_point() +
geom_smooth() +
facet_wrap(vars(sex))
facet_wrap()vars(sex) indique la variable des panneaux
ggplot2R pour les utilisateurs et utilisatrices de SAS